We use cookies to enhance the usability of our website. If you continue, we'll assume that you are happy to receive all cookies. More information. Don't show this again.
Fields »
 

Field

Term
Gene name

Class

Subclass

Chromosome

External id

In atlas

Reliability

Reliability

Reliability

Validation

Method

Validation

Method

Validation

Method

Validation

Location

Searches

Tissue

Cell type

Expression

Tissue

Specificity

Cell line

Specificity

Cancer

Specificity

Tissue

Detectable

Cell line

Detectable

Cancer

Detectable

Cancer

Prognosis

Category

Score

Score

Score

Antibodies

Column


ABOUT
HELP
BLOG
  • THE HUMAN PROTEOME
  • THE HUMAN TISSUES
  • THE HUMAN CELL
  • HUMAN PATHOLOGY
  • PROTEIN CLASSES
  • PROTEIN EVIDENCE
    • NEWS
    • BLOG
    • EVENTS
    • PRESS ROOM
    • LEARN
    • DICTIONARY
    • METHODS
    • CELL LINES
  • THE PROJECT
  • INTRODUCTION
  • ORGANIZATION
  • PUBLICATIONS
  • PUBLICATION DATA
  • ANTIBODY SUBMISSION
  • ANTIBODY AVAILABILITY
  • LINKS
  • CONTACT
  • TECHNICAL DATA
  • ANTIBODY VALIDATION
  • ASSAYS & ANNOTATION
  • DISCLAIMER
  • DOWNLOADABLE DATA
  • HELP & FAQ
  • LICENCE & CITATION
  • PRIVACY STATEMENT
  • RELEASE HISTORY
BARX2
  • premium

    TISSUE

  • premium

    CELL

  • PATHOLOGY

TISSUE ATLAS PRIMARY DATA

GENE/PROTEIN

Antibody validation


Dictionary


Tissue proteome

GENERAL INFORMATION

Gene namei

Gene name according to HGNC.

BARX2

Gene descriptioni

Gene description according to HGNC.

BARX homeobox 2

Protein classi

Protein class the gene product belongs to according to selected gene lists. List of protein classes.

Predicted intracellular proteins
Transcription factors

Predicted localizationi

Protein localization predicted from several bioinformatic algorithms.

Read more

Intracellular

Number of transcriptsi

Number of protein-coding transcribed from this gene as defined by Ensembl.

1
SHOW MORE

HUMAN PROTEIN ATLAS INFORMATION

RNA tissue categoryi

RNA category is based on mRNA expression levels in the analyzed samples (RNA assay description). The categories include: tissue/cell line enriched, group enriched, tissue/cell line enhanced, expressed in all, mixed and not detected. RNA category is calculated separately for The Cancer Genome Atlas (TCGA) data from cancer tissues and internally generated Human Protein Atlas (HPA) data from normal tissues and cell lines.

Read more

HPA:Tissue enhanced (esophagus, salivary gland)
GTEx:Tissue enhanced (esophagus, salivary gland, vagina)
FANTOM5:Group enriched (esophagus, salivary gland, tonsil)

Protein evidencei

Protein evidence scores are generated from several independent sources and are classified as evidence at i) protein level, ii) transcript level, iii) no evidence, or iv) not available.

Evidence at protein level

Protein expressioni

A summary of the overall protein expression pattern across the analyzed normal tissues. The summary is based on knowledge-based annotation.

"Estimation of protein expression could not be performed. View primary data." is shown for genes analyzed with a knowledge-based approach where available RNA-seq and gene/protein characterization data has been evaluated as not sufficient in combination with immunohistochemistry data to yield a reliable estimation of the protein expression profile.

Read more

Nuclear expression in salivary gland and squamous epithelium.

DATA RELIABILITY

Data reliability
descriptioni

Standardized explanatory sentences with additional information required for full understanding of the knowledge-based expression profile.

Antibody staining mainly consistent with RNA expression data.

Reliability scorei

Reliability score (score description), divided into Supported, Approved, or Uncertain, is evaluated in normal tissues and based on consistency between the staining pattern of one antibody or several antibodies with RNA-seq data and available gene/protein characterization data.

Read more

Supported based on 1 antibody.
CAB033311
SHOW MORE

RNA AND PROTEIN EXPRESSION SUMMARYi

Below is an overview of RNA and protein expression data generated in the Human Protein Atlas project. Analyzed tissues are divided into color-coded groups according to which functional features they have in common. For each group, a list of included tissues is accessed by clicking on group name, group symbol, RNA bar, or protein bar. Subsequent selection of a particular tissue in this list links to the image data page. Images of selected tissues give a visual summary of the protein expression profile furthest to the right. The gray human body provides links to a histology dictionary when clicking on any part of the figure.

RNA expression (TPM)i
RNA-seq results generated in HPA are reported as number of transcripts per million (TPM). Each bar represents the highest expression score found in a particular group of tissues. The assay is described more in detail in Assays & Annotation.
Protein expression (score)i
Each bar represents the highest expression score found in a particular group of tissues. Protein expression scores are based on a best estimate of the "true" protein expression from a knowledge-based annotation, described more in detail under Assays & annotation. For genes where more than one antibody has been used, a collective score is set displaying the estimated true protein expression.

Read more
Brain
Cerebral cortex
Hippocampus
N/A
Caudate
N/A
Cerebellum
N/A
Endocrine tissues
Thyroid gland
Parathyroid gland
Adrenal gland
Bone marrow & immune system
Appendix
Bone marrow
Lymph node
Tonsil
Spleen
Muscle tissues
Heart muscle
Skeletal muscle
Smooth muscle
Lung
Nasopharynx
N/A
Bronchus
N/A
Lung
Liver & gallbladder
Liver
Gallbladder
Pancreas
Pancreas
Gastrointestinal tract
Oral mucosa
N/A
Salivary gland
Esophagus
Stomach
Duodenum
Small intestine
Colon
Rectum
Kidney & urinary bladder
Kidney
Urinary bladder
Male tissues
Testis
Epididymis
Prostate
Seminal vesicle
Female tissues
Breast
Vagina
N/A
Cervix, uterine
Endometrium
Fallopian tube
Ovary
Placenta
Adipose & soft tissue
Adipose tissue
Soft tissue
N/A
Skin
Skin
Cerebral cortex

Lymph node

Liver

Salivary gland

Colon

Kidney

Testis

PROTEIN EXPRESSION OVERVIEWi

Protein expression data is shown for each of the 44 tissues. The color-coding is based on tissues with functional features in common. Mouse-over function shows protein score for analyzed cell types found in a selected tissue. To access image data click on tissue name or bar. Annotation of protein expression is described in detail in Assays & annotation.

For genes with available protein data for which a knowledge-based annotation gave inconclusive results, no protein expression data is displayed in the protein expression data overview, however, all immunohistochemical images are still available and the annotation data can be found under Primary data.

Organ
Expression
Alphabetical

RNA EXPRESSION OVERVIEWi

RNA expression overview shows RNA-data from three different sources: Internally generated Human Protein Atlas (HPA) RNA-seq data, RNA-seq data from the Genotype-Tissue Expression (GTEx) project and CAGE data from FANTOM5 project. Color-coding is based on tissue groups, each consisting of tissues with functional features in common. To access sample data, click on tissue name or bar.

HPA dataseti

HPA dataset
RNA-seq tissue data is reported as mean TPM (transcripts per million), corresponding to mean values of the different individual samples from each tissue. Color-coding is based on tissue groups, each consisting of tissues with functional features in common. To access sample data, click on tissue name or bar. The RNA-seq assay is described in detail in Assays & Annotation.

RNA tissue category HPA
HPA RNA tissue category (category description) is calculated based on mRNA expression levels across all tissues and include: tissue enriched, group enriched, tissue enhanced, expressed in all, mixed and not detected.
Organ
Expression
Alphabetical
RNA tissue category: Tissue enhanced (esophagus, salivary gland)
GTEx dataseti

GTEx dataset
RNA-seq data are reported as median RPKM (reads per kilobase per million mapped reads), generated by the Genotype-Tissue Expression (GTEx) project. More information can be found in Assays & Annotation.

RNA tissue category GTEx
GTEx RNA tissue category (category description) is calculated based on mRNA expression levels across all tissues and include: tissue enriched, group enriched, tissue enhanced, expressed in all, mixed and not detected.
Organ
Expression
Alphabetical
RNA tissue category: Tissue enhanced (esophagus, salivary gland, vagina)
FANTOM5 dataseti

FANTOM5 dataset
Tissue data obtained through Cap Analysis of Gene Expression (CAGE) are reported as Tags Per Million, generated by the FANTOM5 project. More information can be found in Assays & Annotation.

RNA tissue category FANTOM5
FANTOM5 RNA tissue category (category description) is calculated based on gene expression levels across all tissues and include: tissue enriched, group enriched, tissue enhanced, expressed in all, mixed and not detected.
Organ
Expression
Alphabetical
RNA tissue category: Group enriched (esophagus, salivary gland, tonsil)
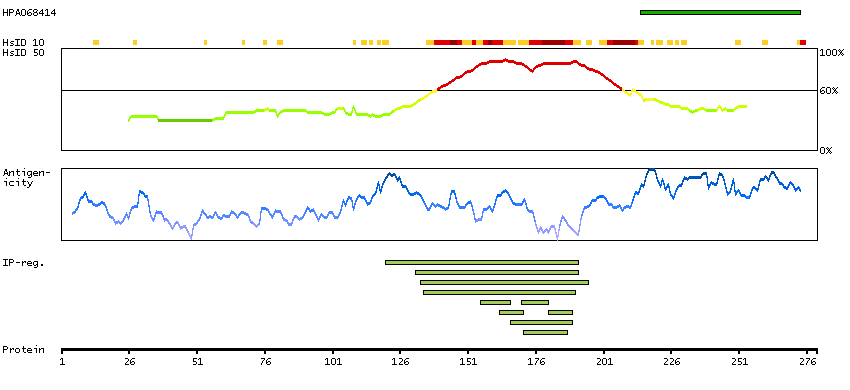
GENE INFORMATIONi

Gene information from Ensembl and Entrez, as well as links to available gene identifiers are displayed here. Information was retrieved from Ensembl if not indicated otherwise.

Gene name

BARX2

Synonyms

Description

BARX homeobox 2 (HGNC Symbol)

Entrez gene summary

This gene encodes a member of the homeobox transcription factor family. A highly related protein in mouse has been shown to influence cellular processes that control cell adhesion and remodeling of the actin cytoskeleton in myoblast fusion and chondrogenesis. The encoded protein may also play a role in cancer progression. [provided by RefSeq, Jul 2008]

Chromosome

11

Cytoband

q24.3

Chromosome location (bp)

129375940 - 129452279

Protein evidence

Evidence at protein level (all genes)

Ensembl

ENSG00000043039 (version 83.38)

Entrez gene

8538

UniProt

Q9UMQ3 (UniProt - Evidence at transcript level)

neXtProt

NX_Q9UMQ3

Antibodypedia

BARX2 antibodies

PROTEIN BROWSERi

The protein browser displays the antigen location on the target protein(s) and the features of the target protein. The tabs at the top of the protein view section can be used to switch between the different splice variants to which an antigen has been mapped.

At the top of the view, the position of the antigen (identified by the corresponding HPA identifier) is shown as a green bar. A yellow triangle on the bar indicates a <100% sequence identity to the protein target.

Under the antigens, the maximum percent sequence identity of the protein to all other proteins from other human genes is displayed, using a sliding window of 10 aa residues (HsID 10) or 50 aa residues (HsID 50) (read more).

If a signal peptide is predicted by a majority of the signal peptide predictors SPOCTOPUS, SignalP 4.0, and Phobius (turquoise) and/or transmembrane regions (orange) are predicted by MDM, these are displayed.

Low complexity regions are shown in yellow and InterPro regions in green. Common (purple) and unique (grey) regions between different splice variants of the gene are also displayed (read more), and at the bottom of the protein view is the protein scale.

BARX2-001

PROTEIN INFORMATIONi

The protein information section displays alternative protein-coding transcripts (splice variants) encoded by this gene according to the Ensembl database.

The ENSP identifier links to the Ensembl website protein summary, while the ENST identifier links to the Ensembl website transcript summary for the selected splice variant. The data in the UniProt column can be expanded to show links to all matching UniProt identifiers for this protein.

The protein classes assigned to this protein are shown if expanding the data in the protein class column. Parent protein classes are in bold font and subclasses are listed under the parent class.

The Gene Ontology terms assigned to this protein are listed if expanding the Gene ontology column. The length of the protein (amino acid residues according to Ensembl), molecular mass (kDalton), predicted signal peptide (according to a majority of the signal peptide predictors SPOCTOPUS, SignalP 4.0, and Phobius) and the number of predicted transmembrane region(s) (according to MDM) are also reported.

Splice variant

UniProt

Protein class

Gene ontology

Length & mass

Signal peptide
(predicted)

Transmembrane regions
(predicted)

BARX2-001
ENSP00000281437
ENST00000281437
Q9UMQ3 [Direct mapping]
Homeobox protein BarH-like 2
Show all
Predicted intracellular proteins
Transcription factors
   Helix-turn-helix domains
Show all
GO:0000122 [negative regulation of transcription from RNA polymerase II promoter]
GO:0000977 [RNA polymerase II regulatory region sequence-specific DNA binding]
GO:0001228 [transcriptional activator activity, RNA polymerase II transcription regulatory region sequence-specific binding]
GO:0001502 [cartilage condensation]
GO:0003677 [DNA binding]
GO:0003682 [chromatin binding]
GO:0003700 [transcription factor activity, sequence-specific DNA binding]
GO:0005515 [protein binding]
GO:0005667 [transcription factor complex]
GO:0005730 [nucleolus]
GO:0006355 [regulation of transcription, DNA-templated]
GO:0006366 [transcription from RNA polymerase II promoter]
GO:0014902 [myotube differentiation]
GO:0043565 [sequence-specific DNA binding]
GO:0045944 [positive regulation of transcription from RNA polymerase II promoter]
Show all
279 aa
31.2 kDa
No 0

Contact

  • BLOG
  • PRESS ROOM
  • contact@proteinatlas.org

The Project

  • INTRODUCTION
  • ORGANIZATION
  • PUBLICATIONS
  • DOWNLOADABLE DATA

The Human Protein Atlas

  • ANTIBODY AVAILABILITY
  • LICENCE & CITATION
  • HELP & FAQ
The Human Protein Atlas project is funded
by the Knut & Alice Wallenberg foundation.