TISSUE
CELL
PATHOLOGY
Antibody validation
Dictionary
SMOOTH MUSCLE - Expression summary
Protein expression
RNA expression
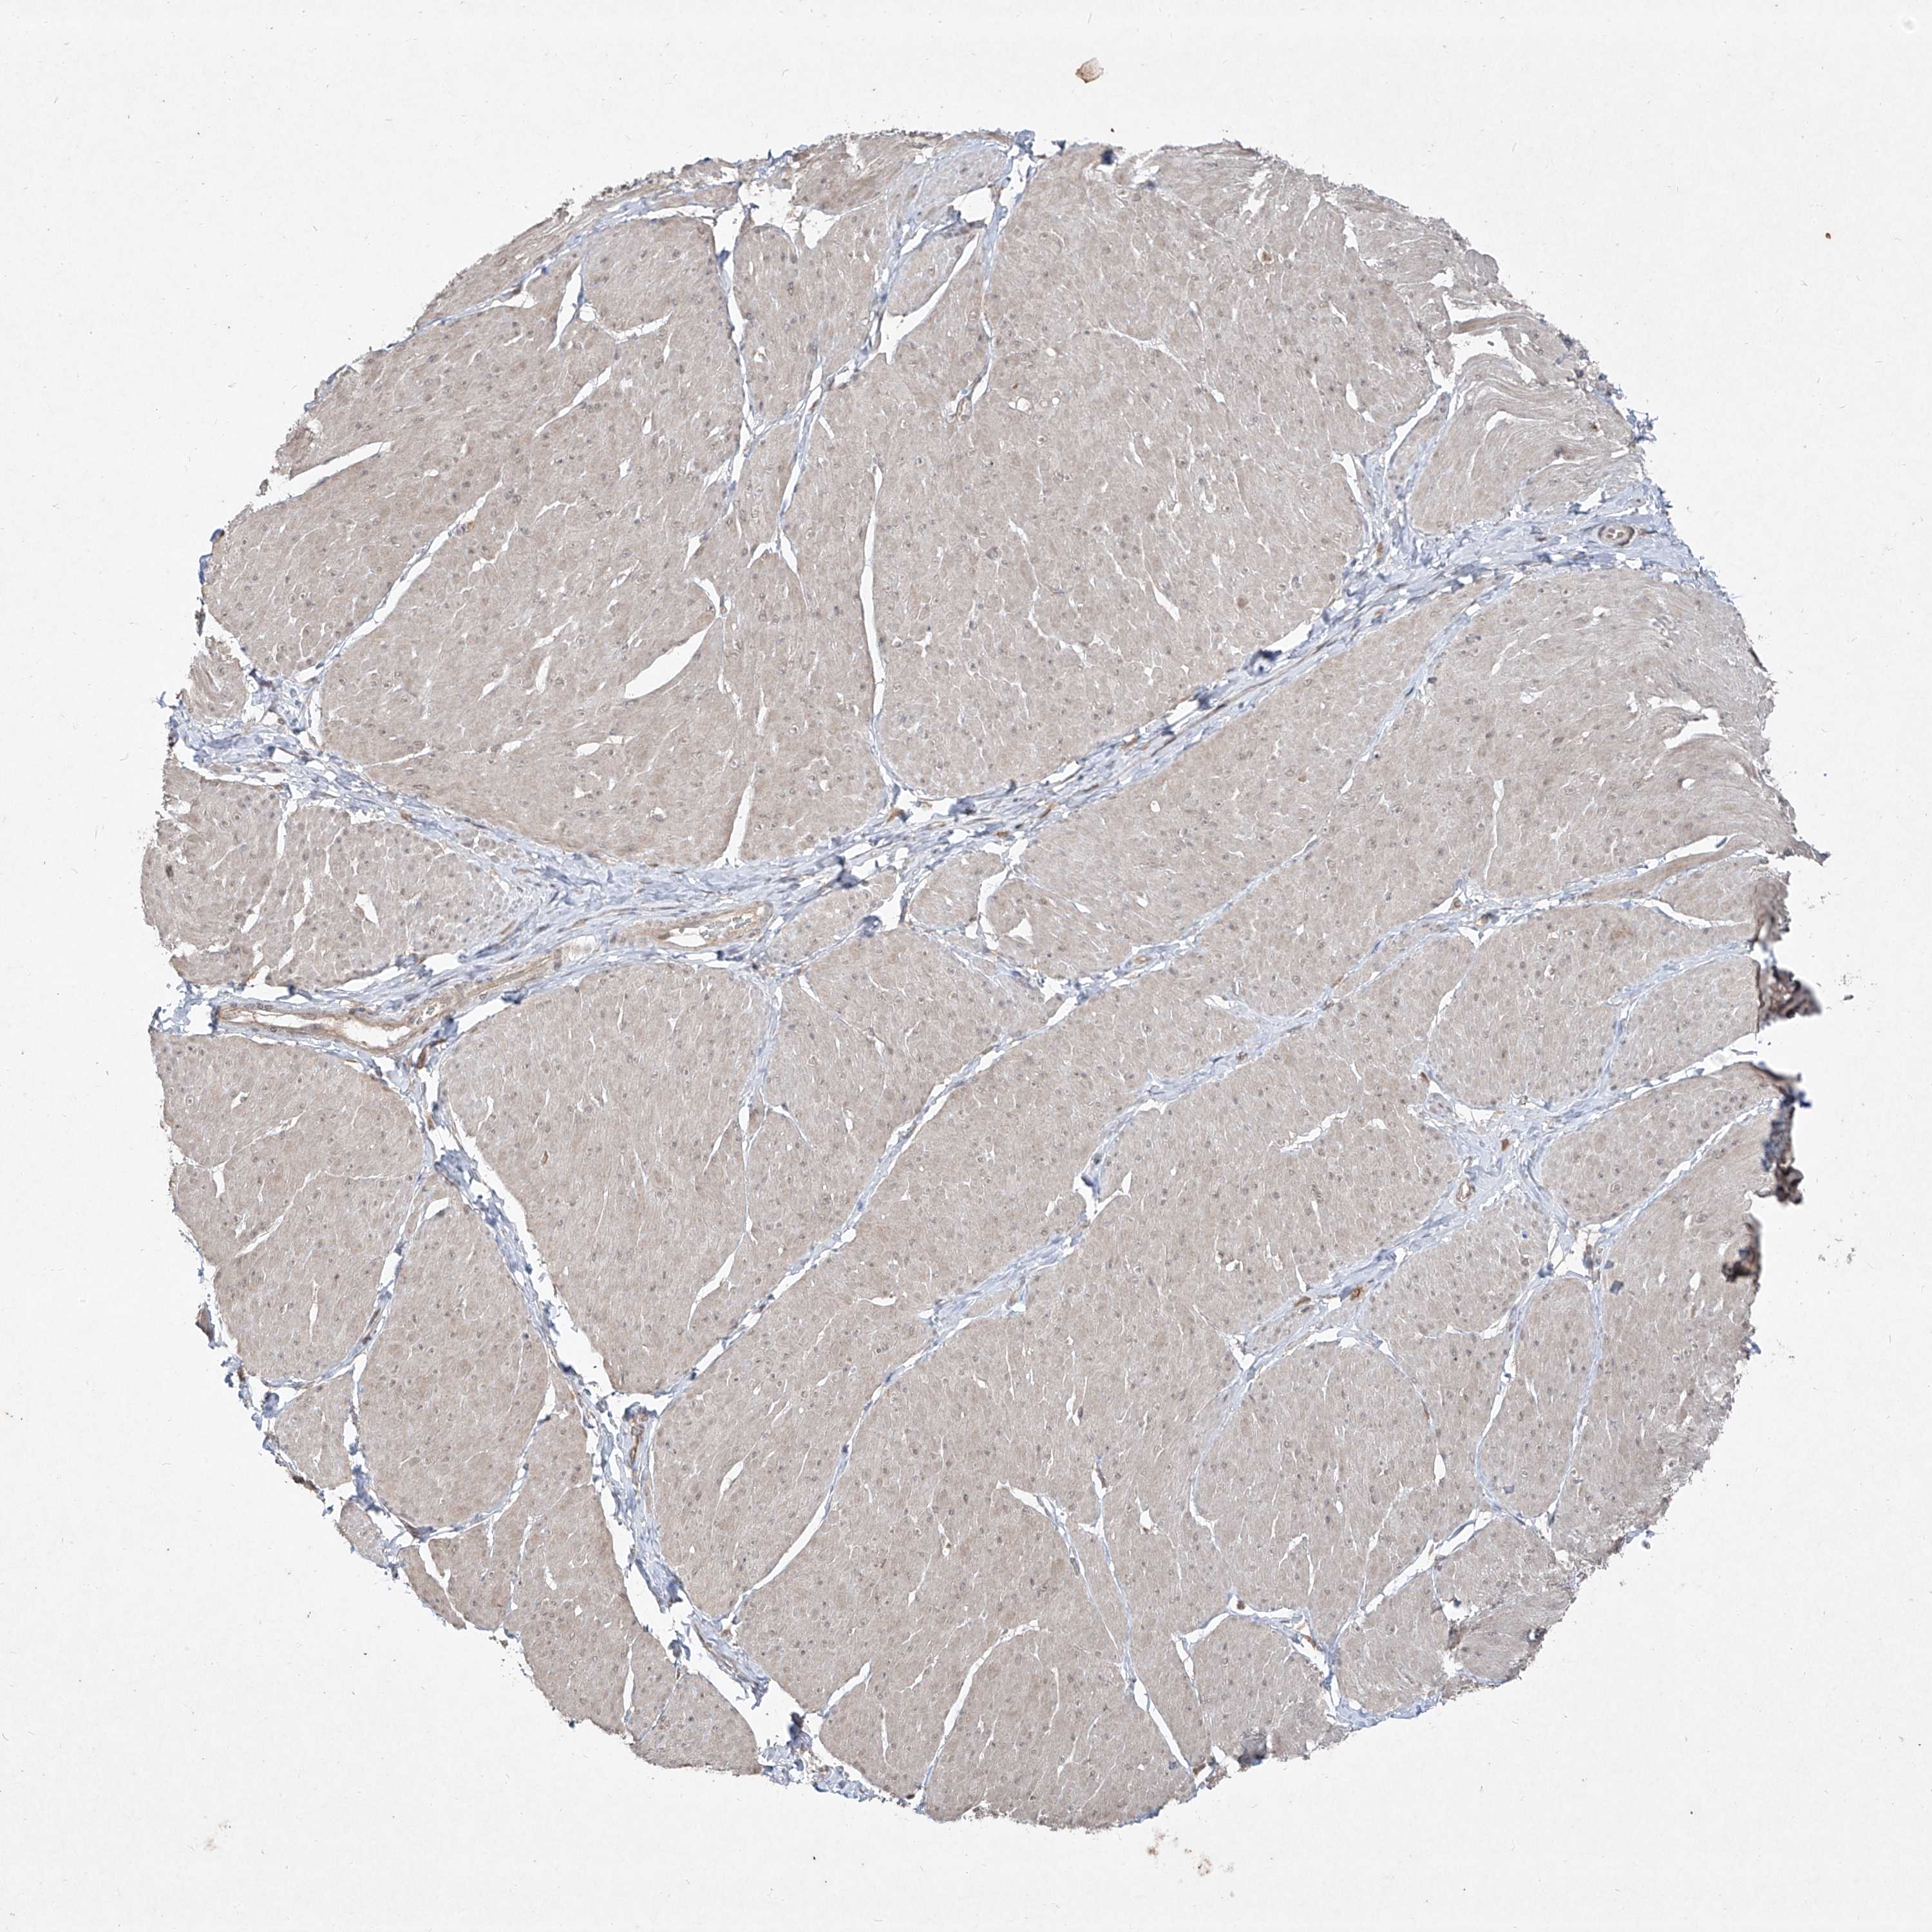
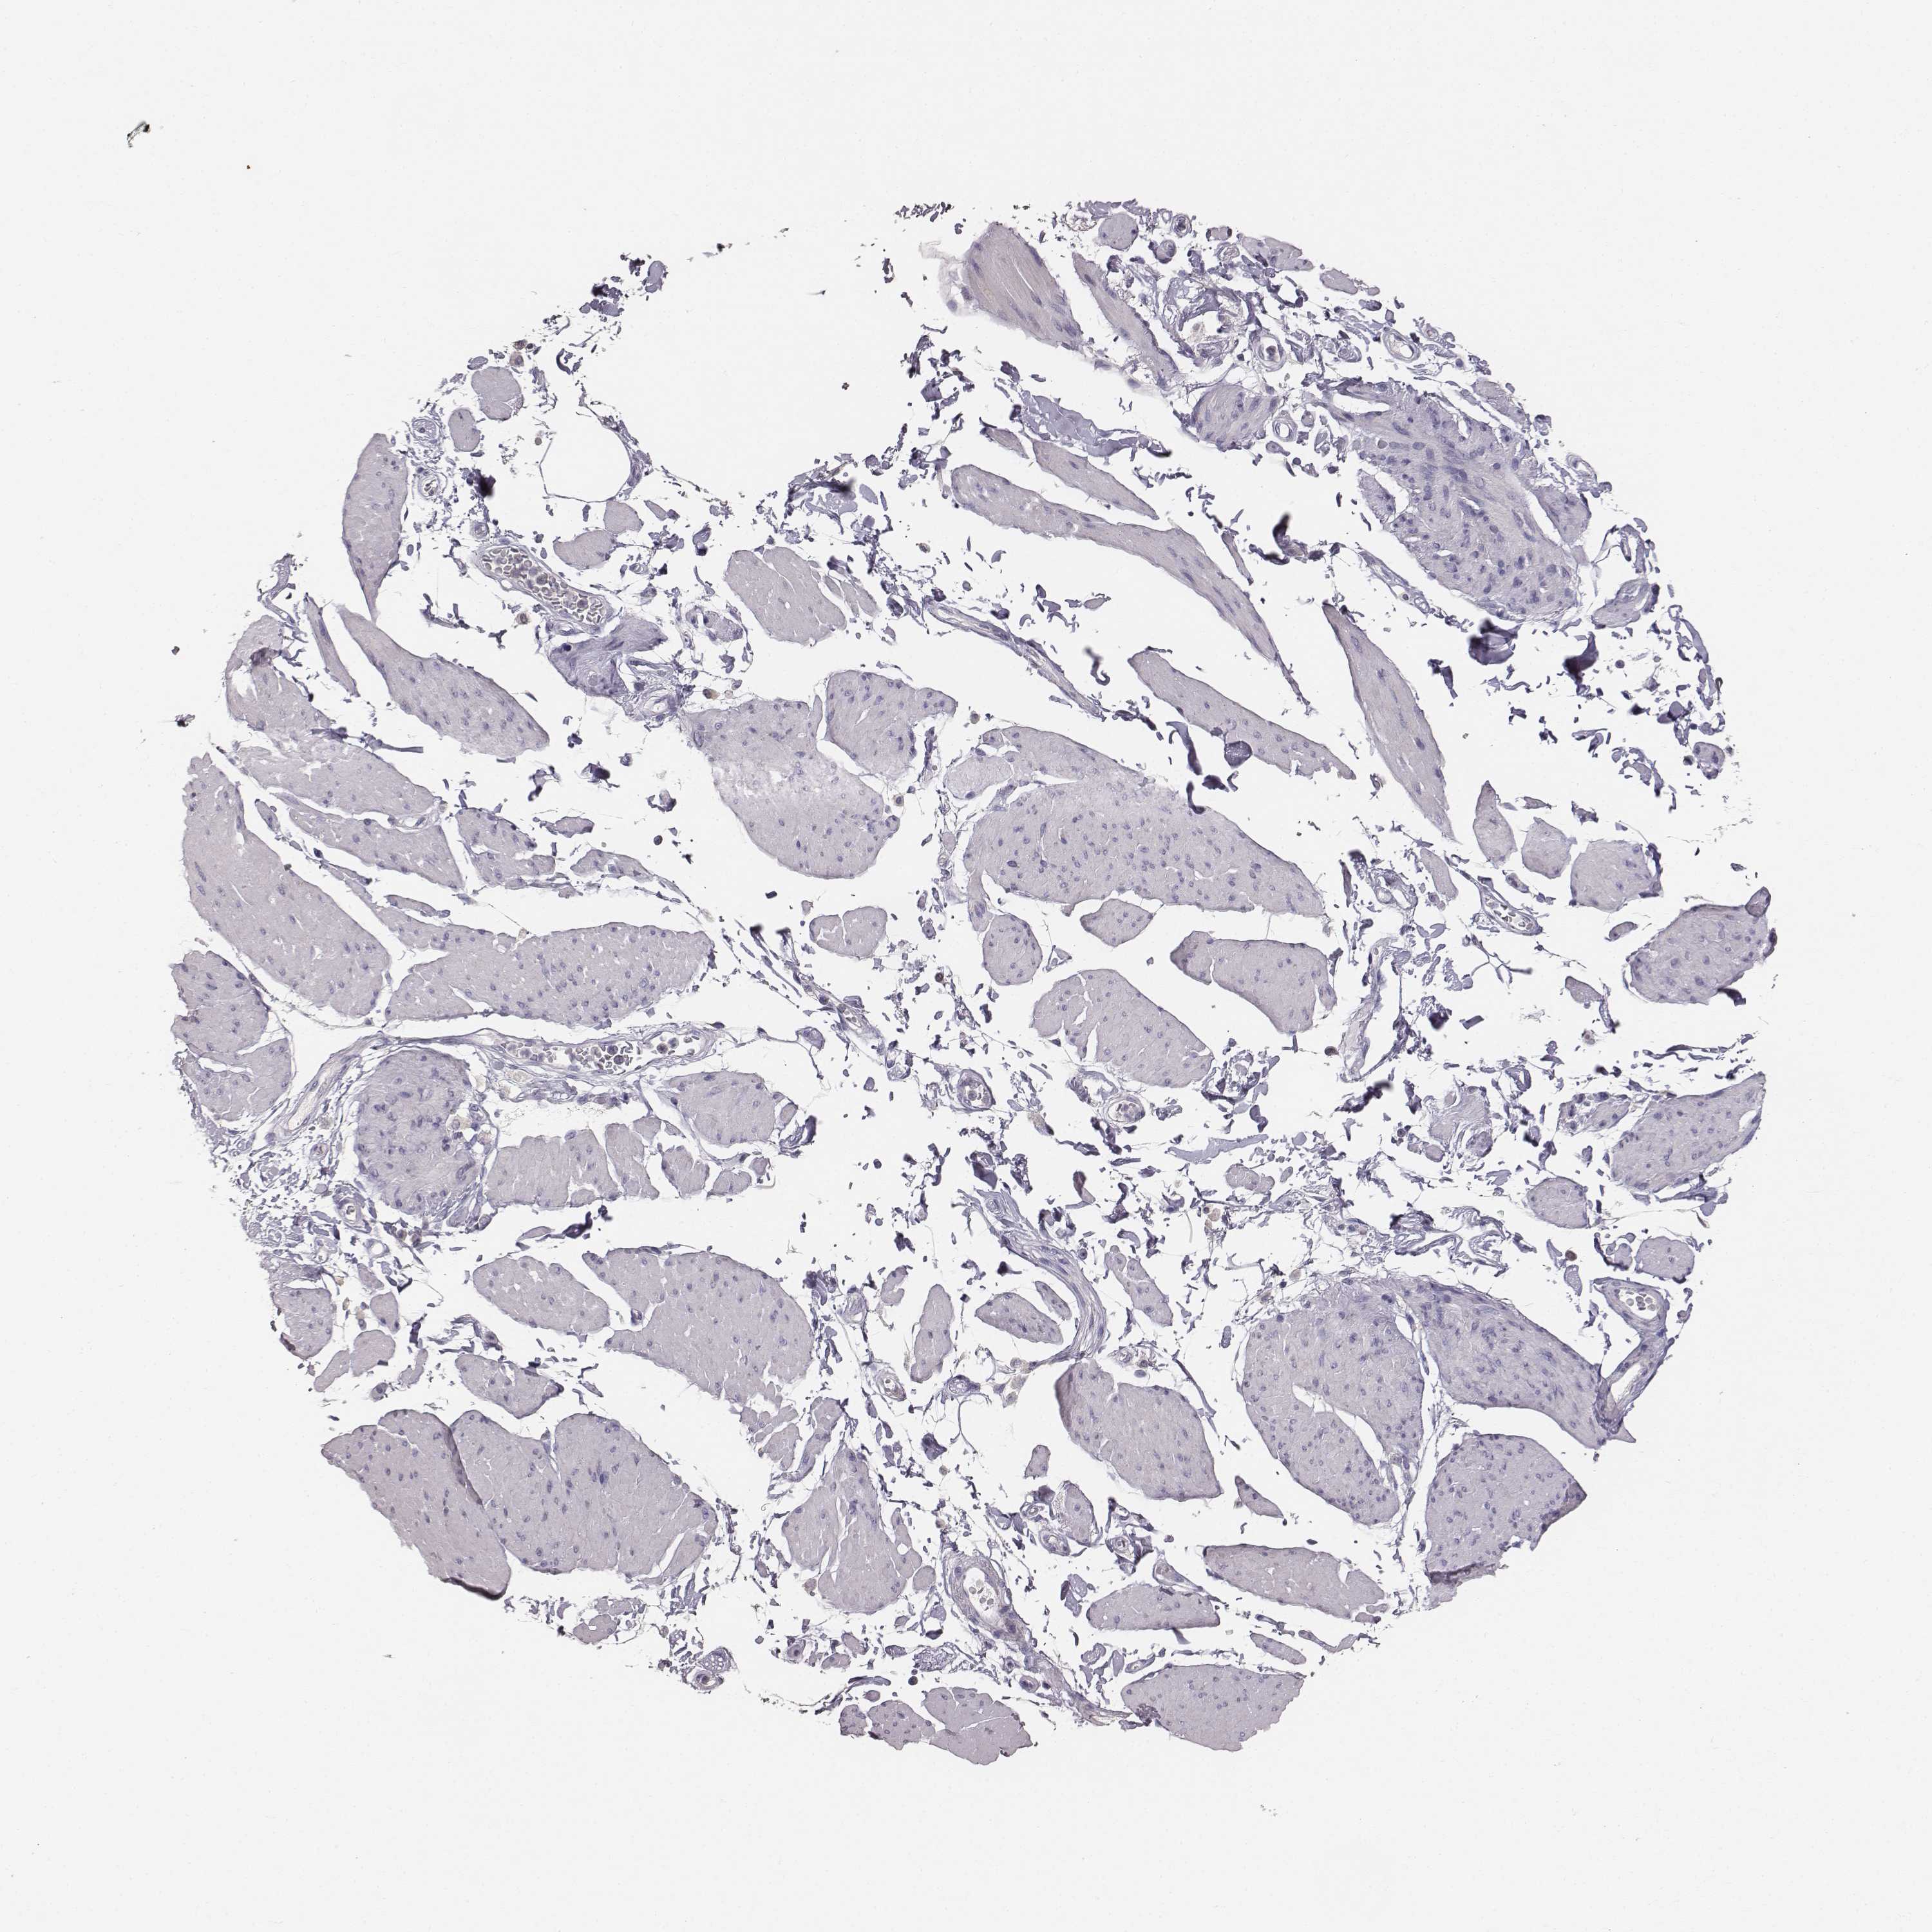
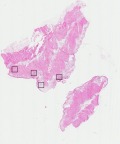
SMOOTH MUSCLE - Annotated protein expression
Annotated proteinexpression
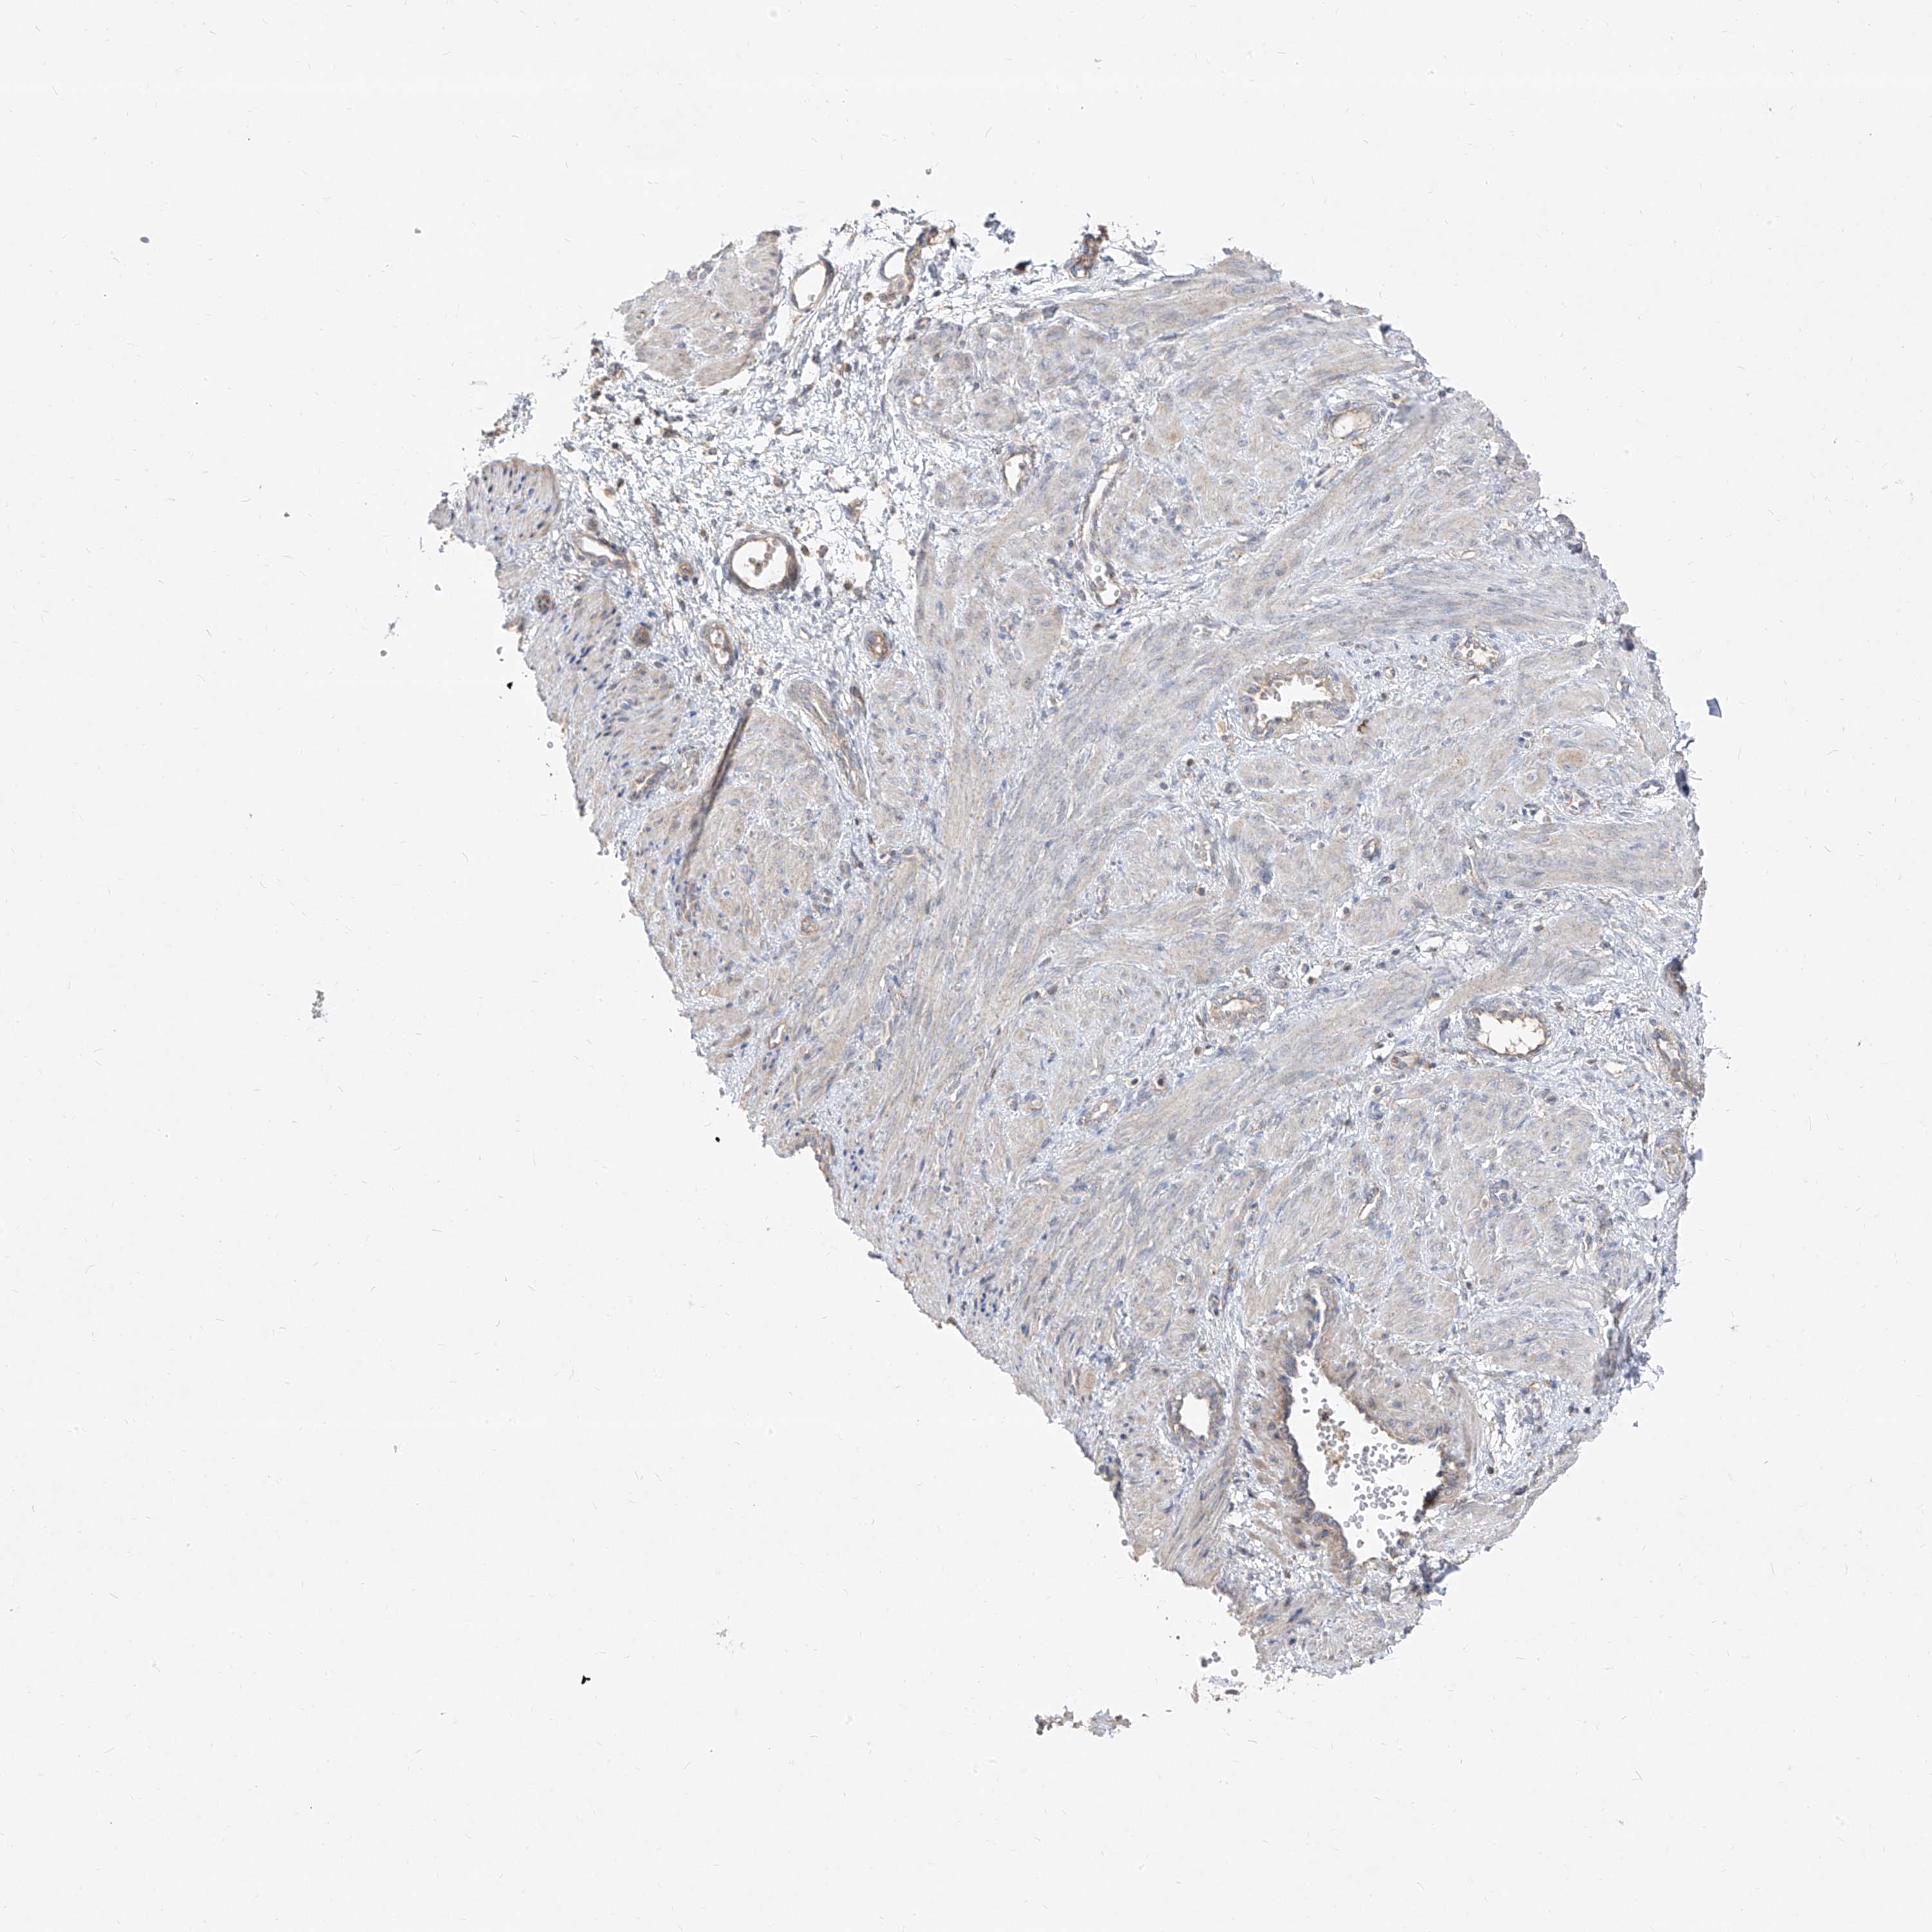
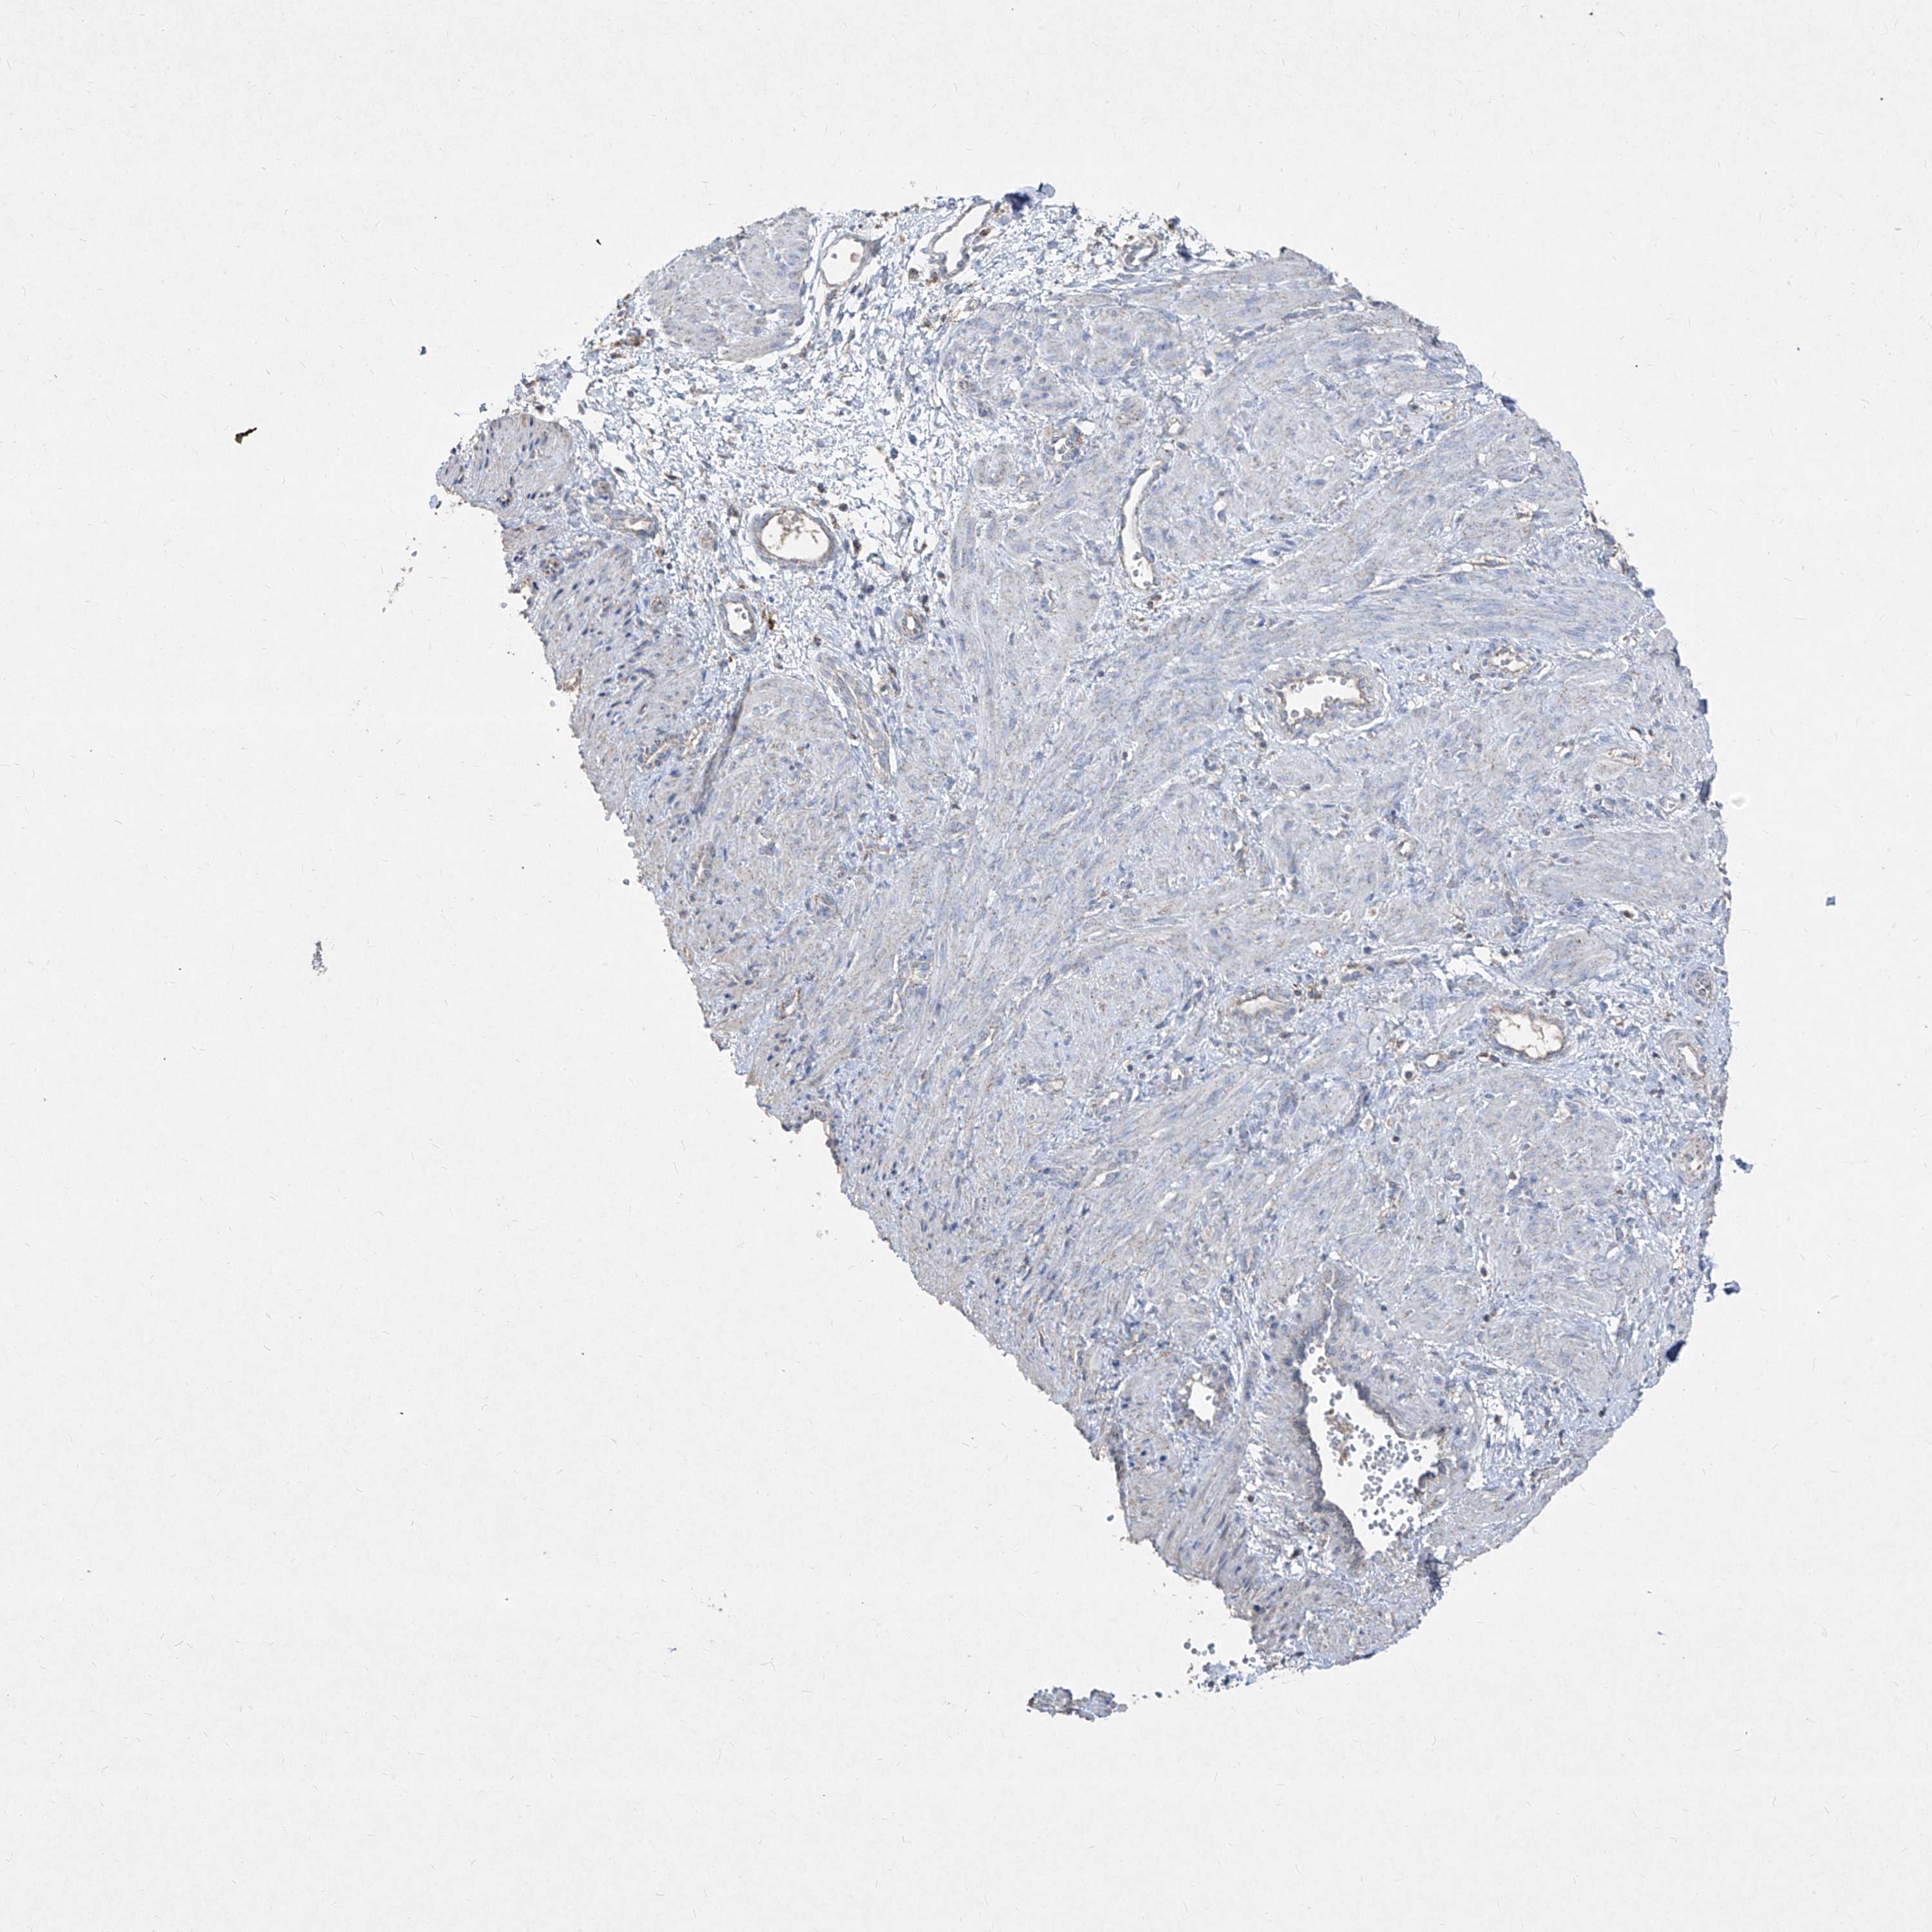
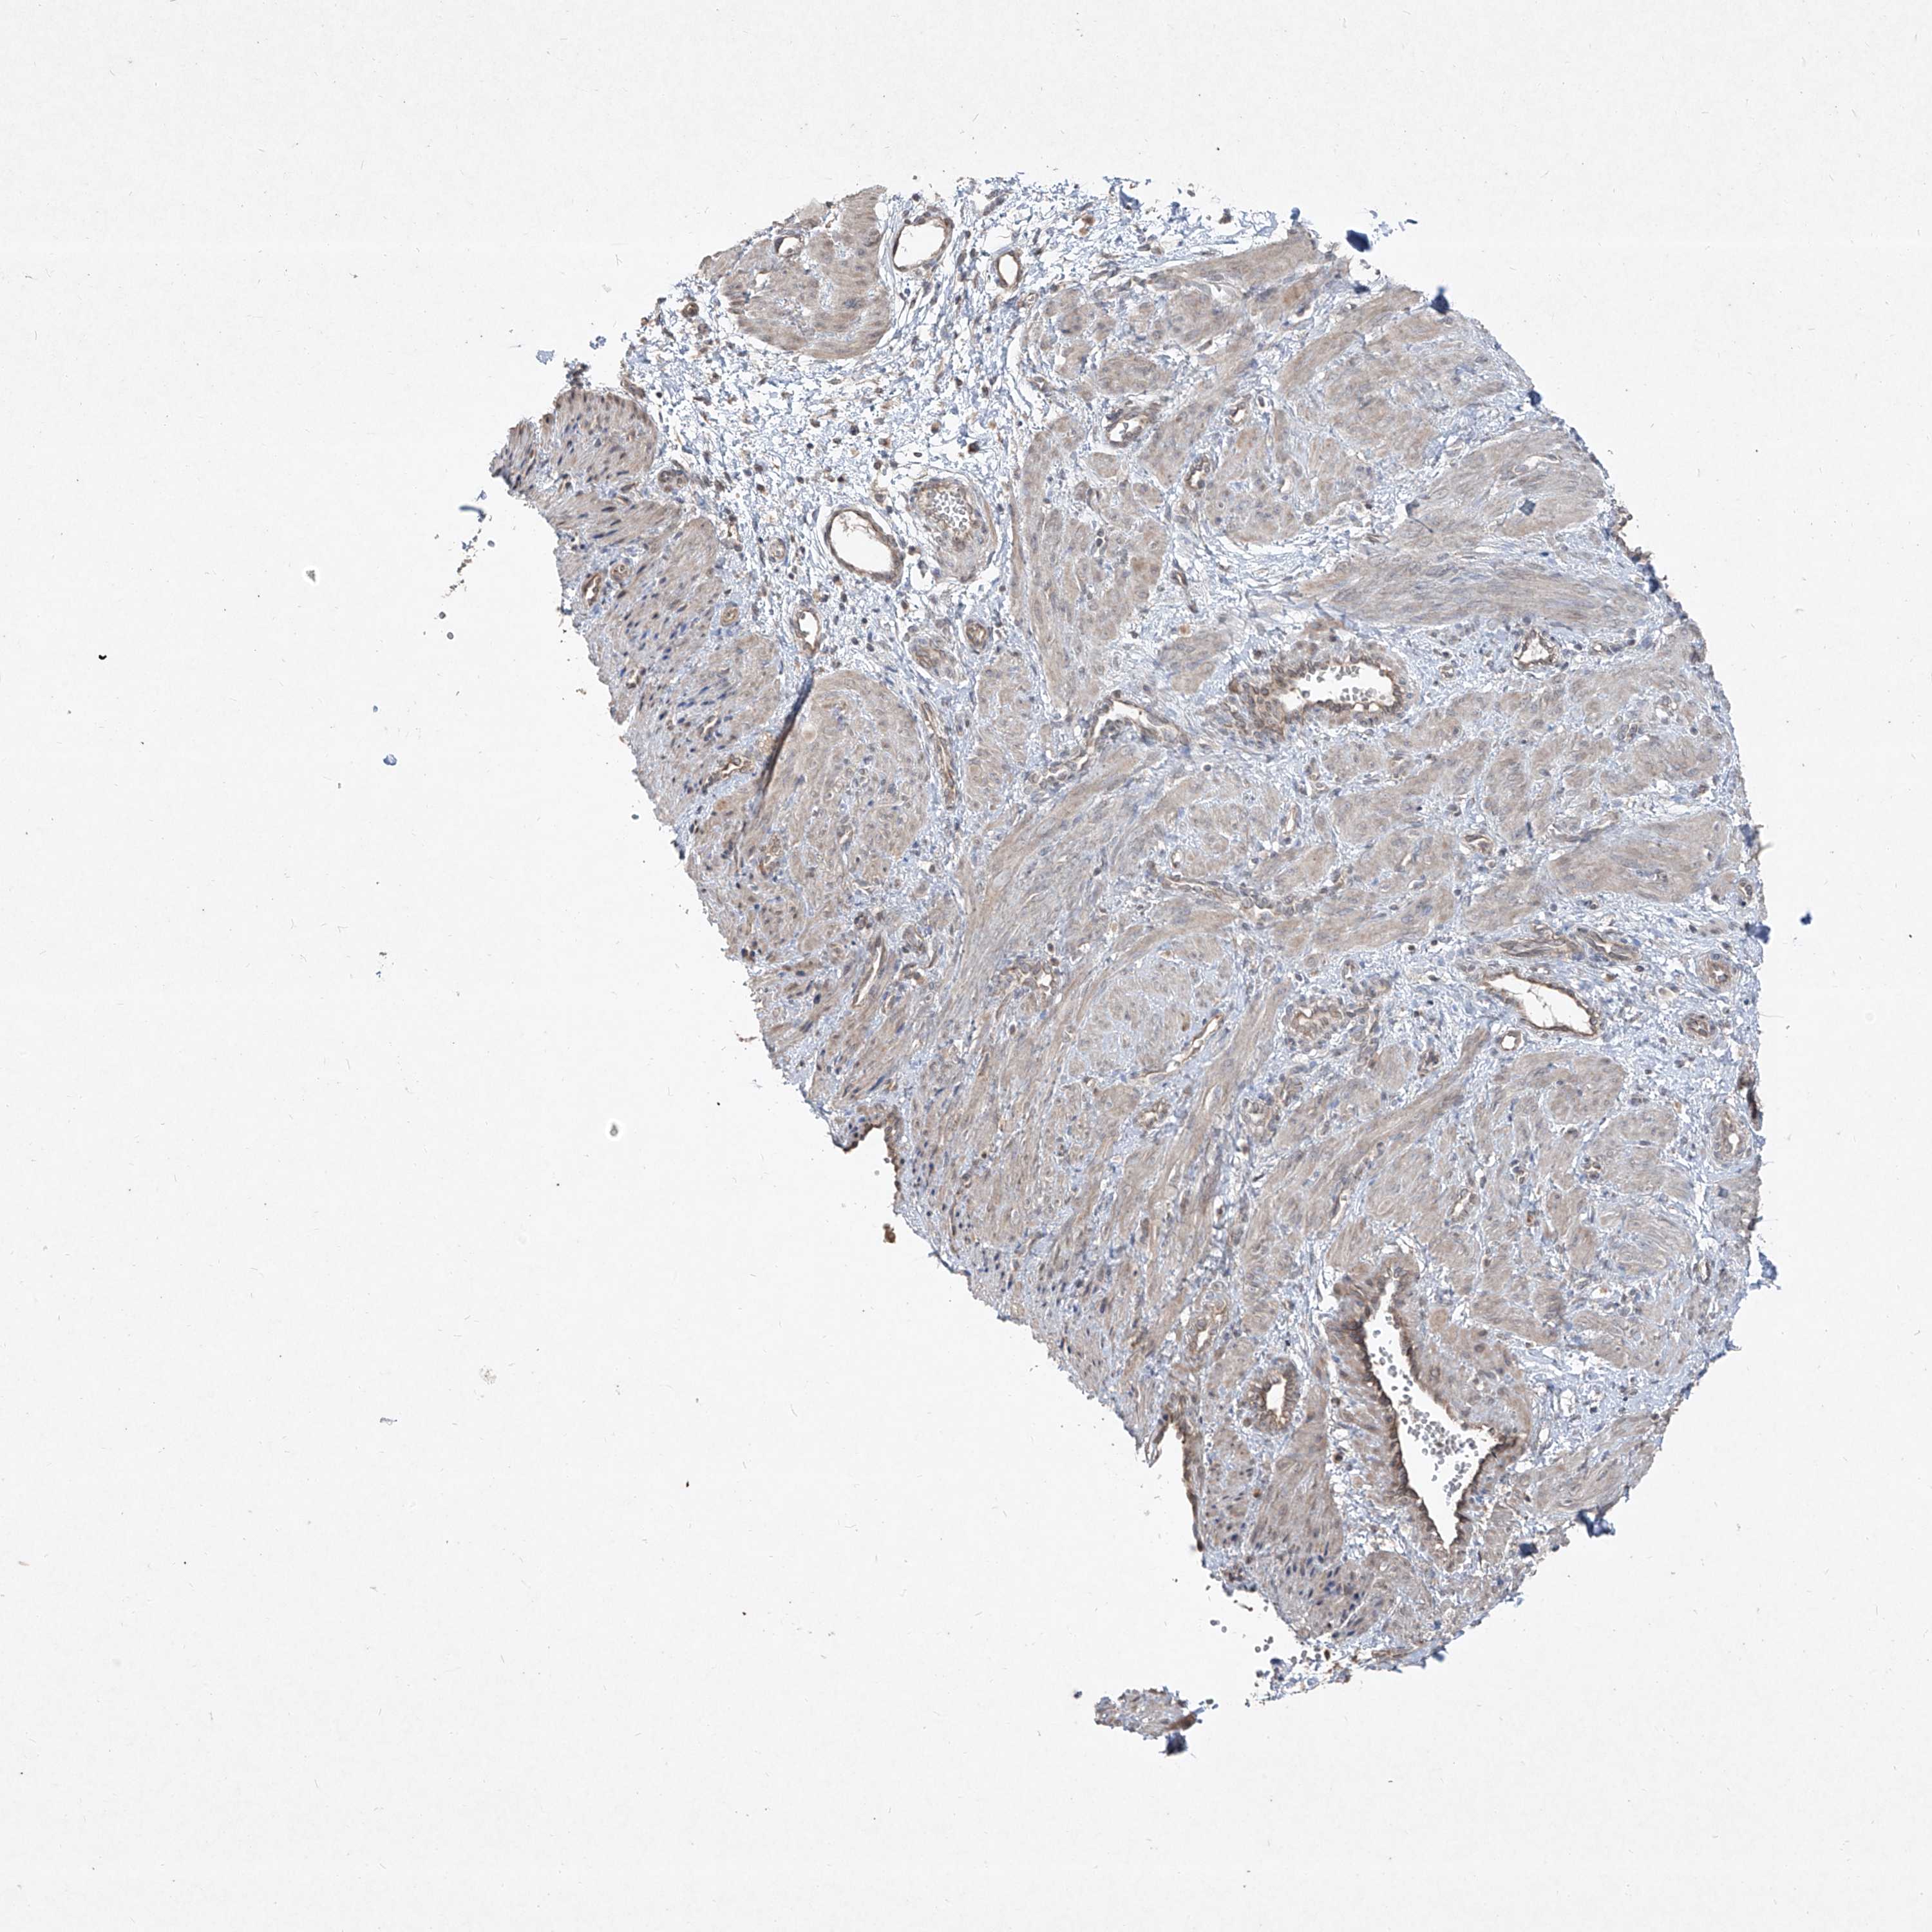
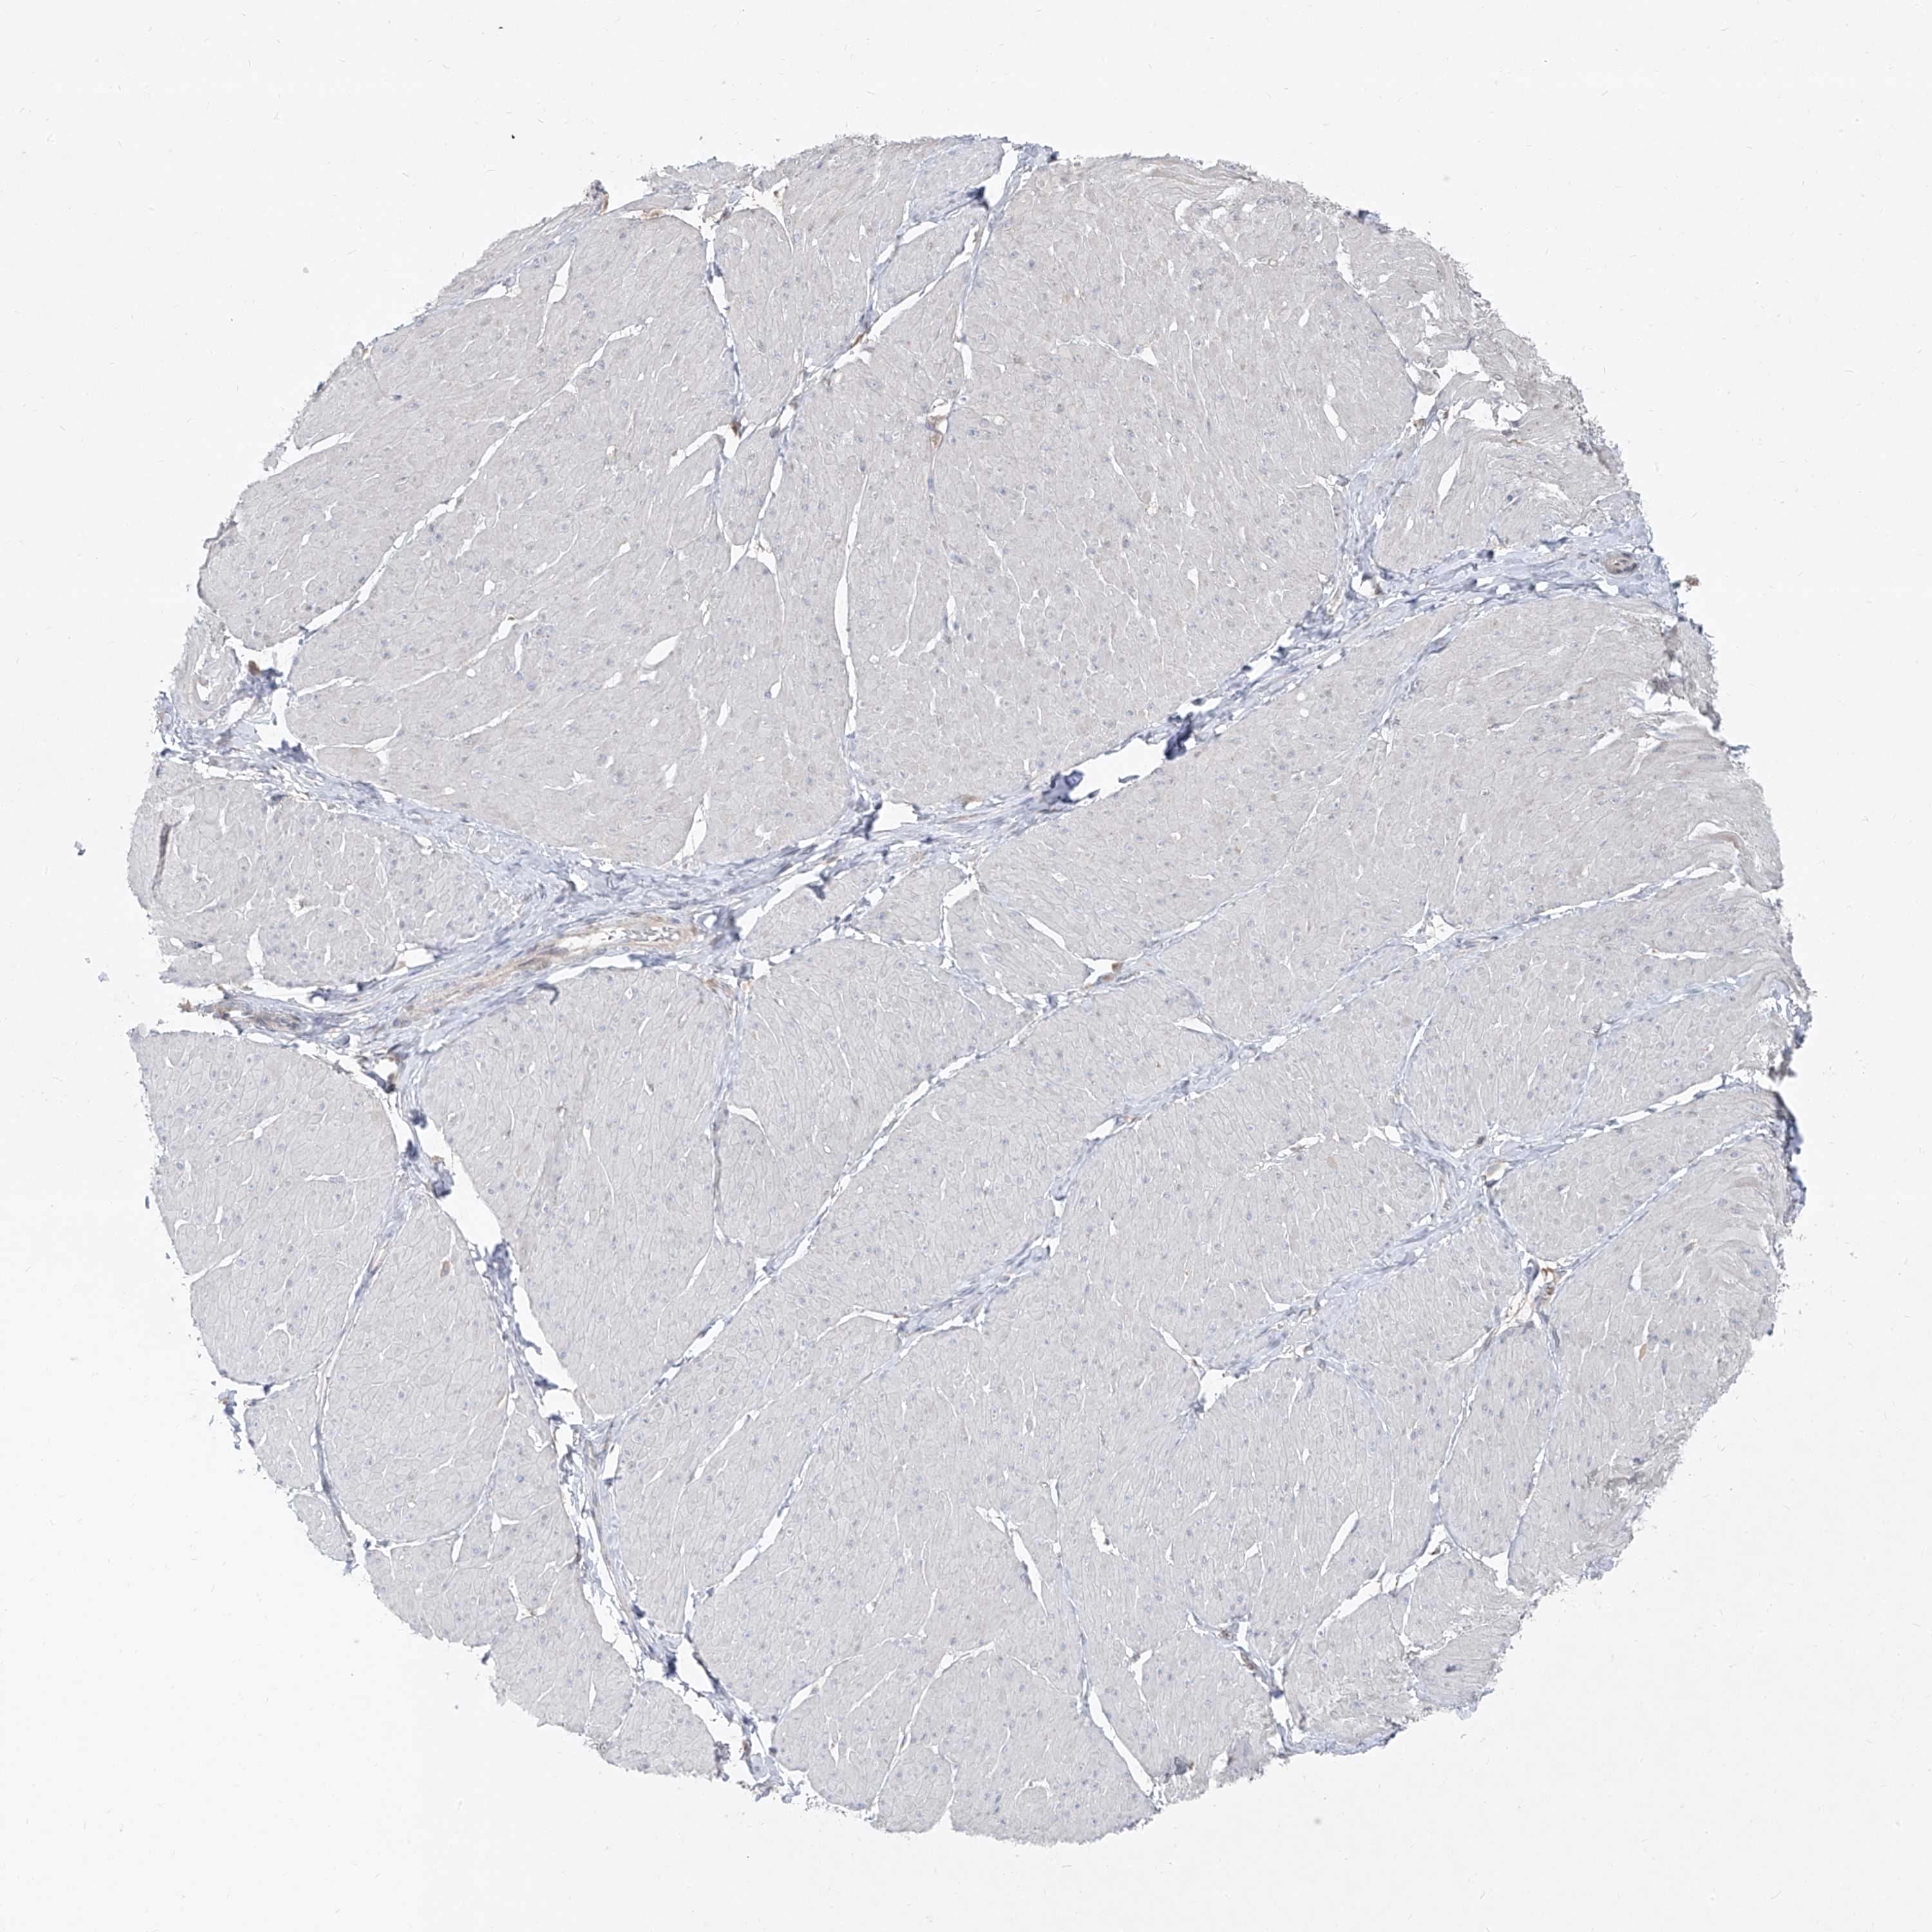
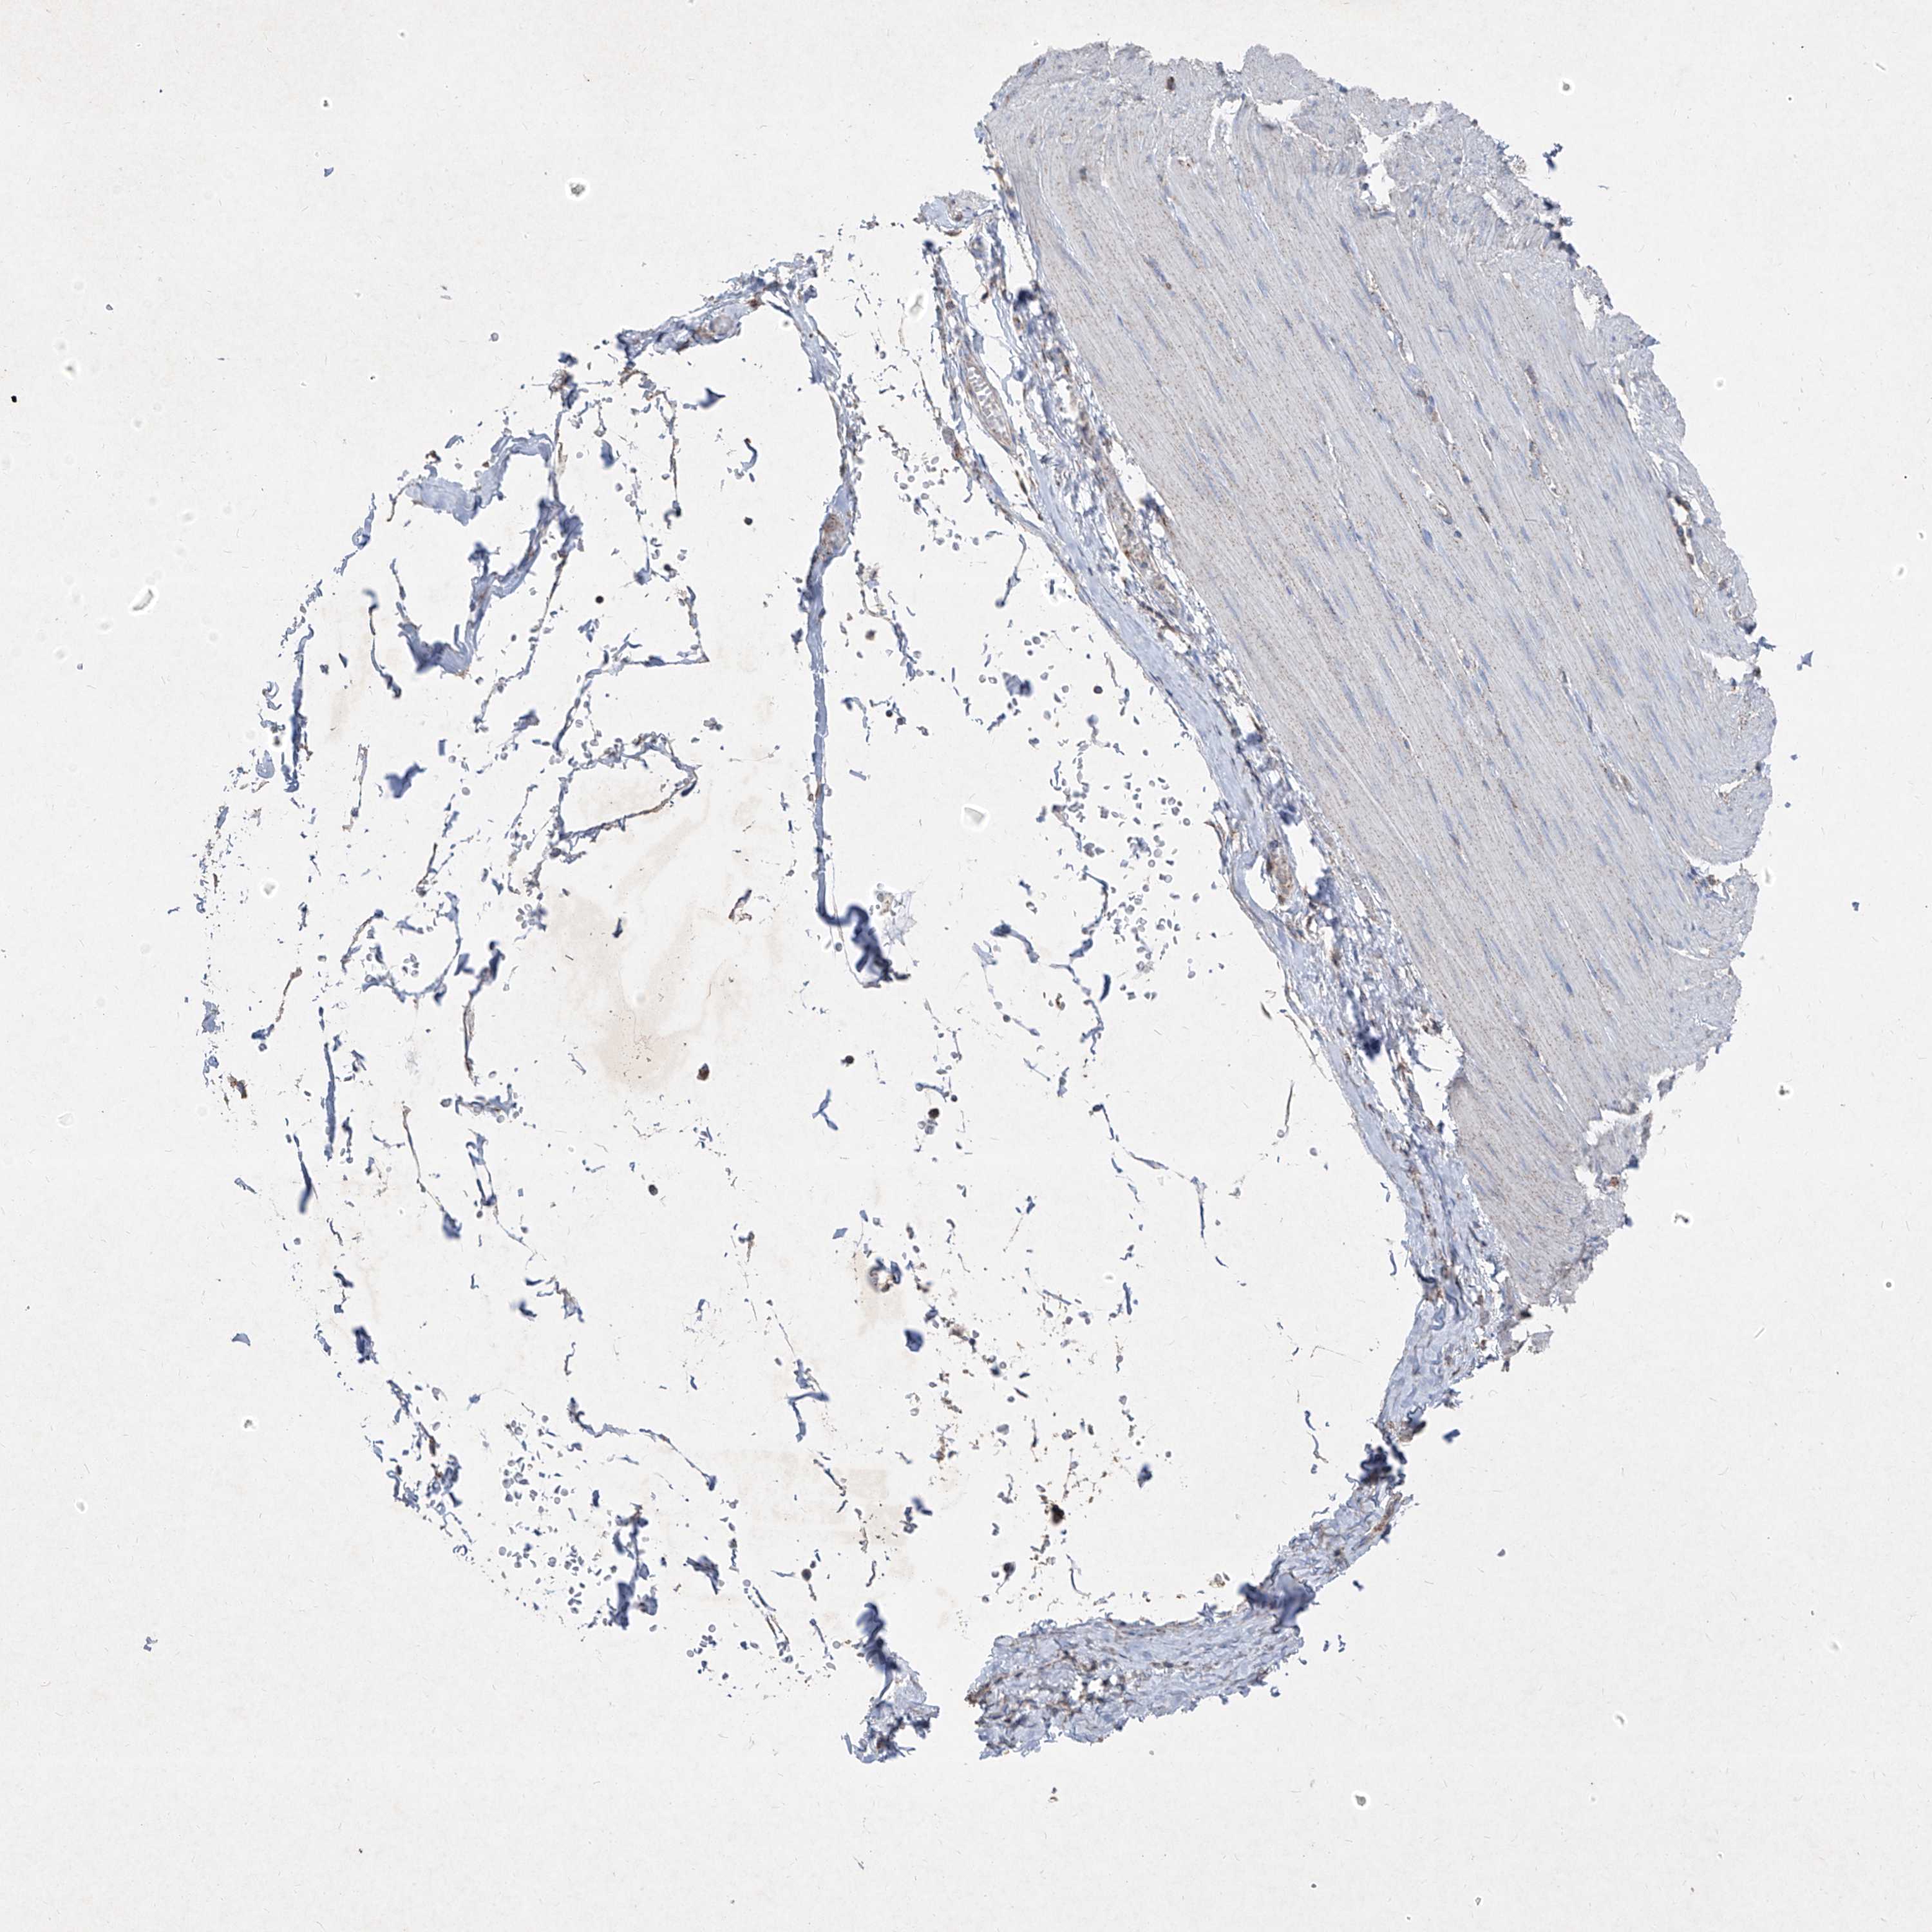
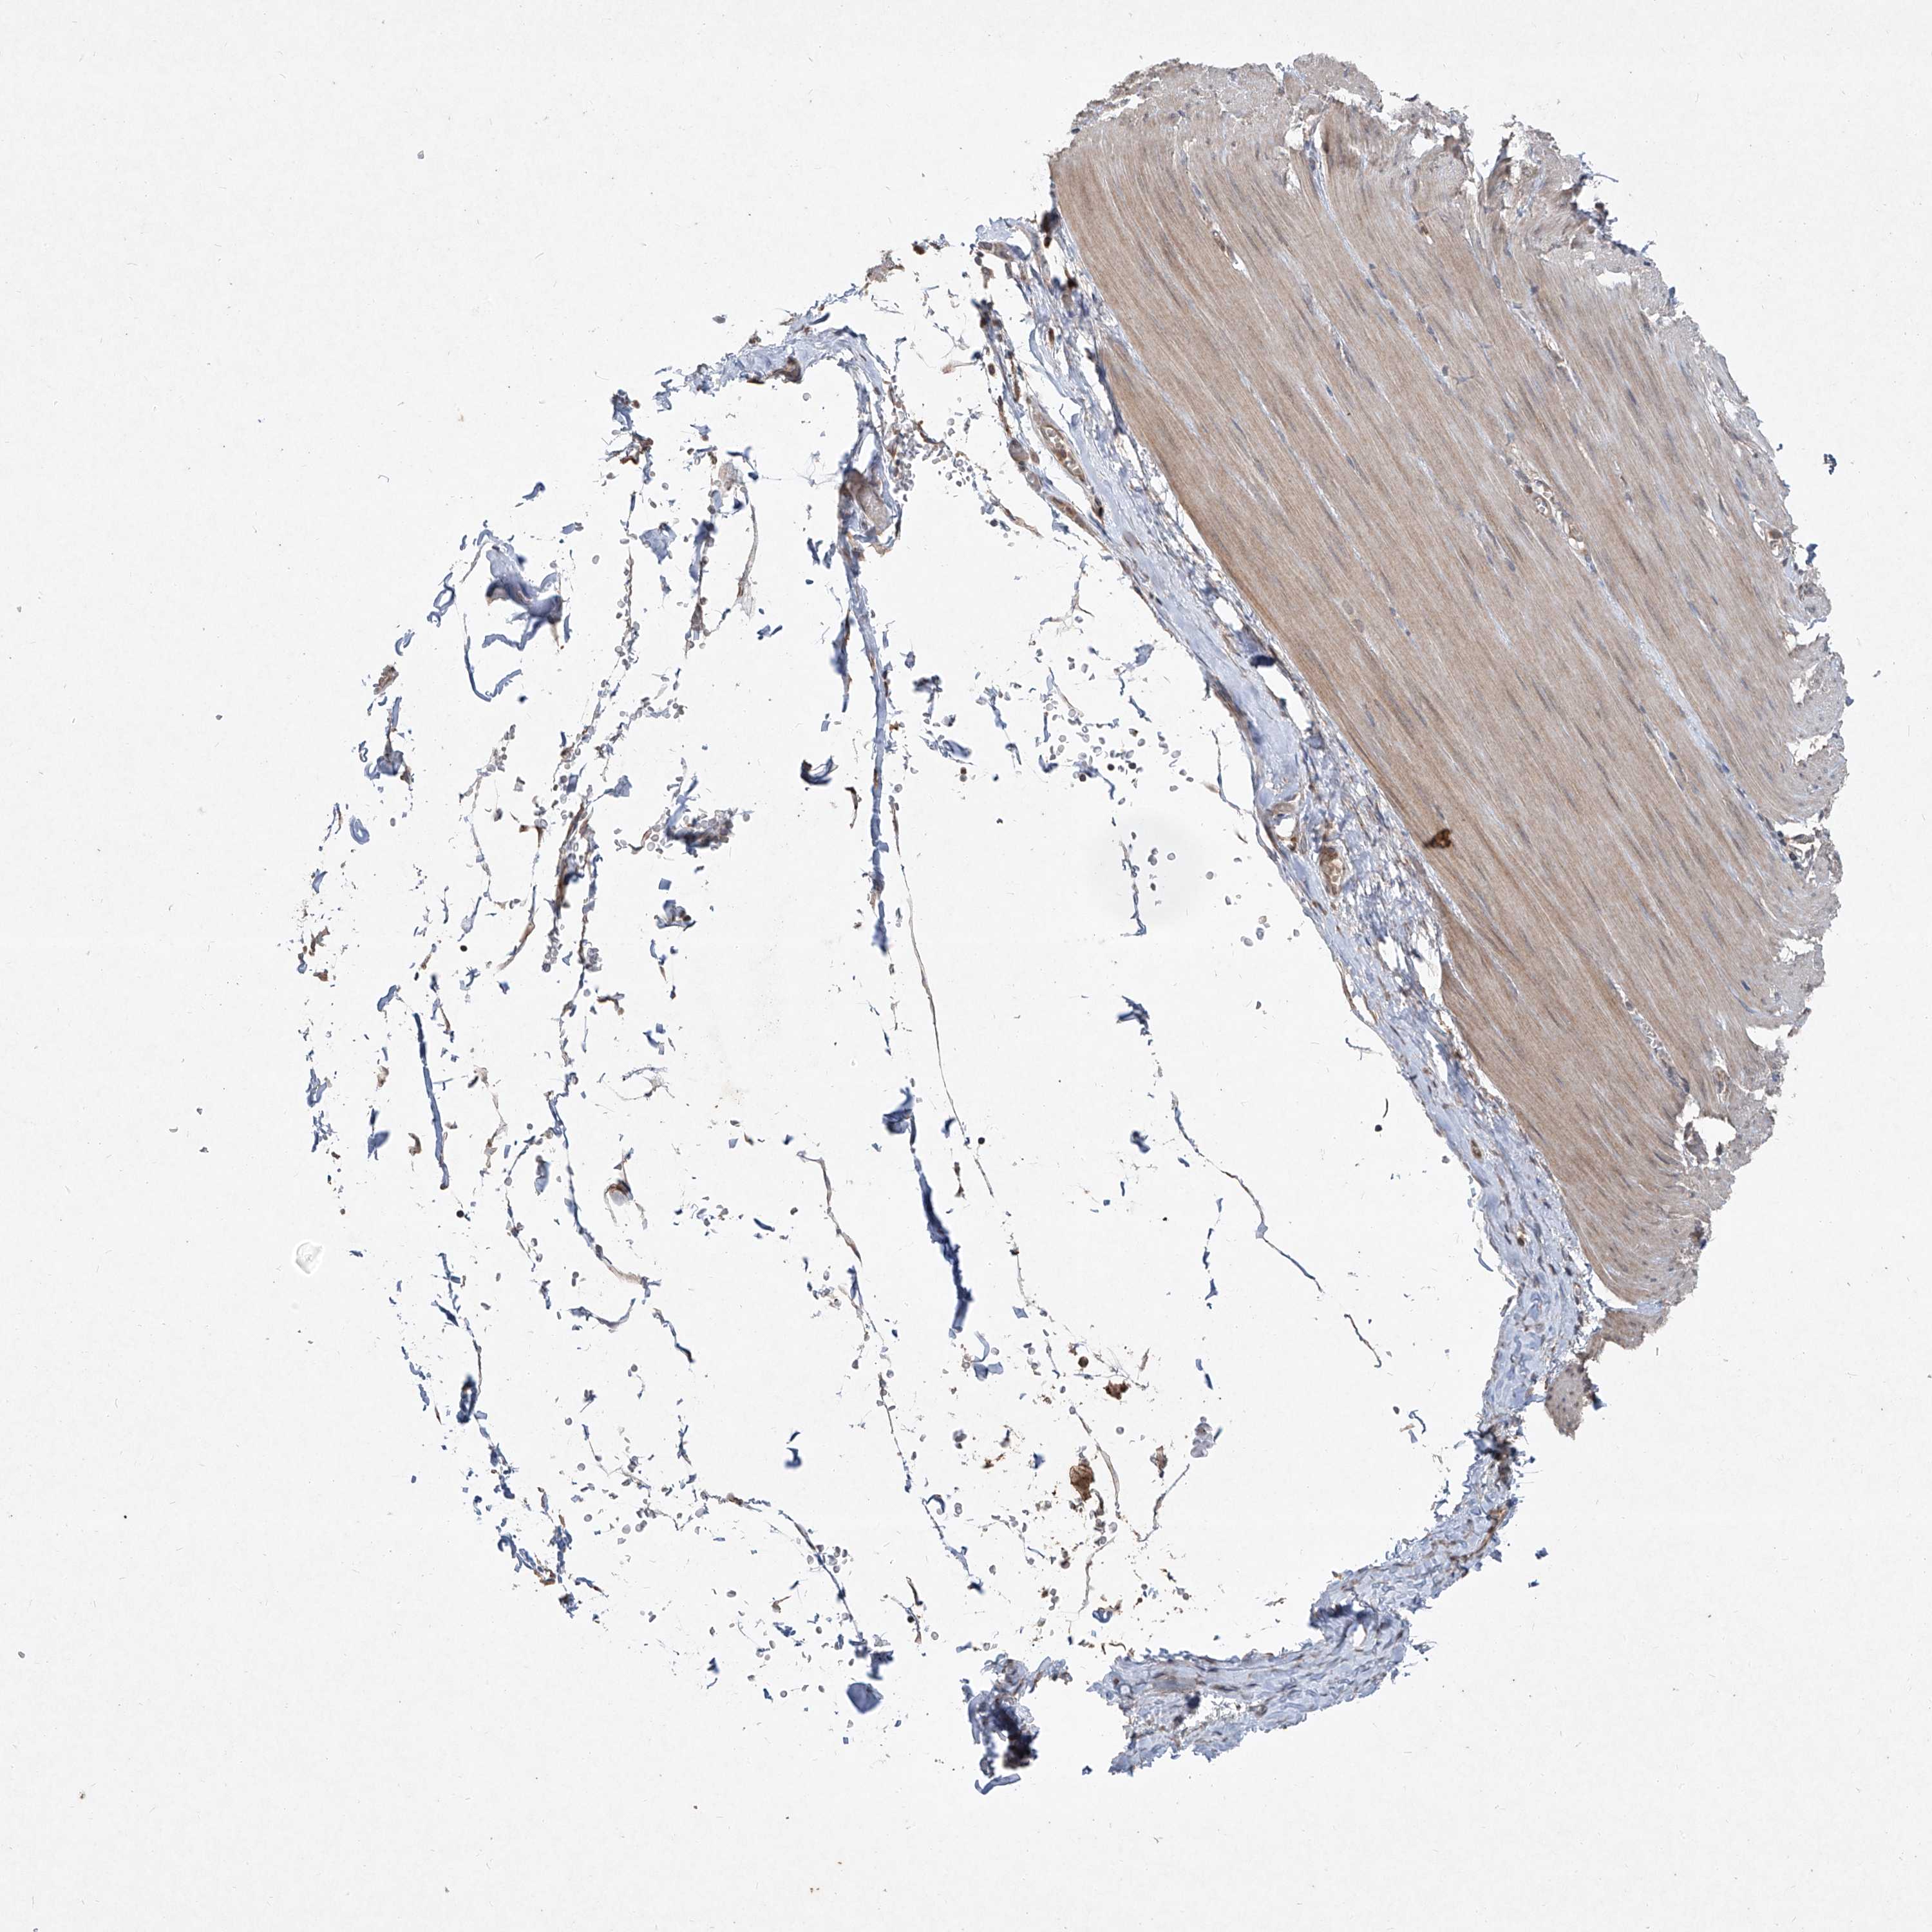
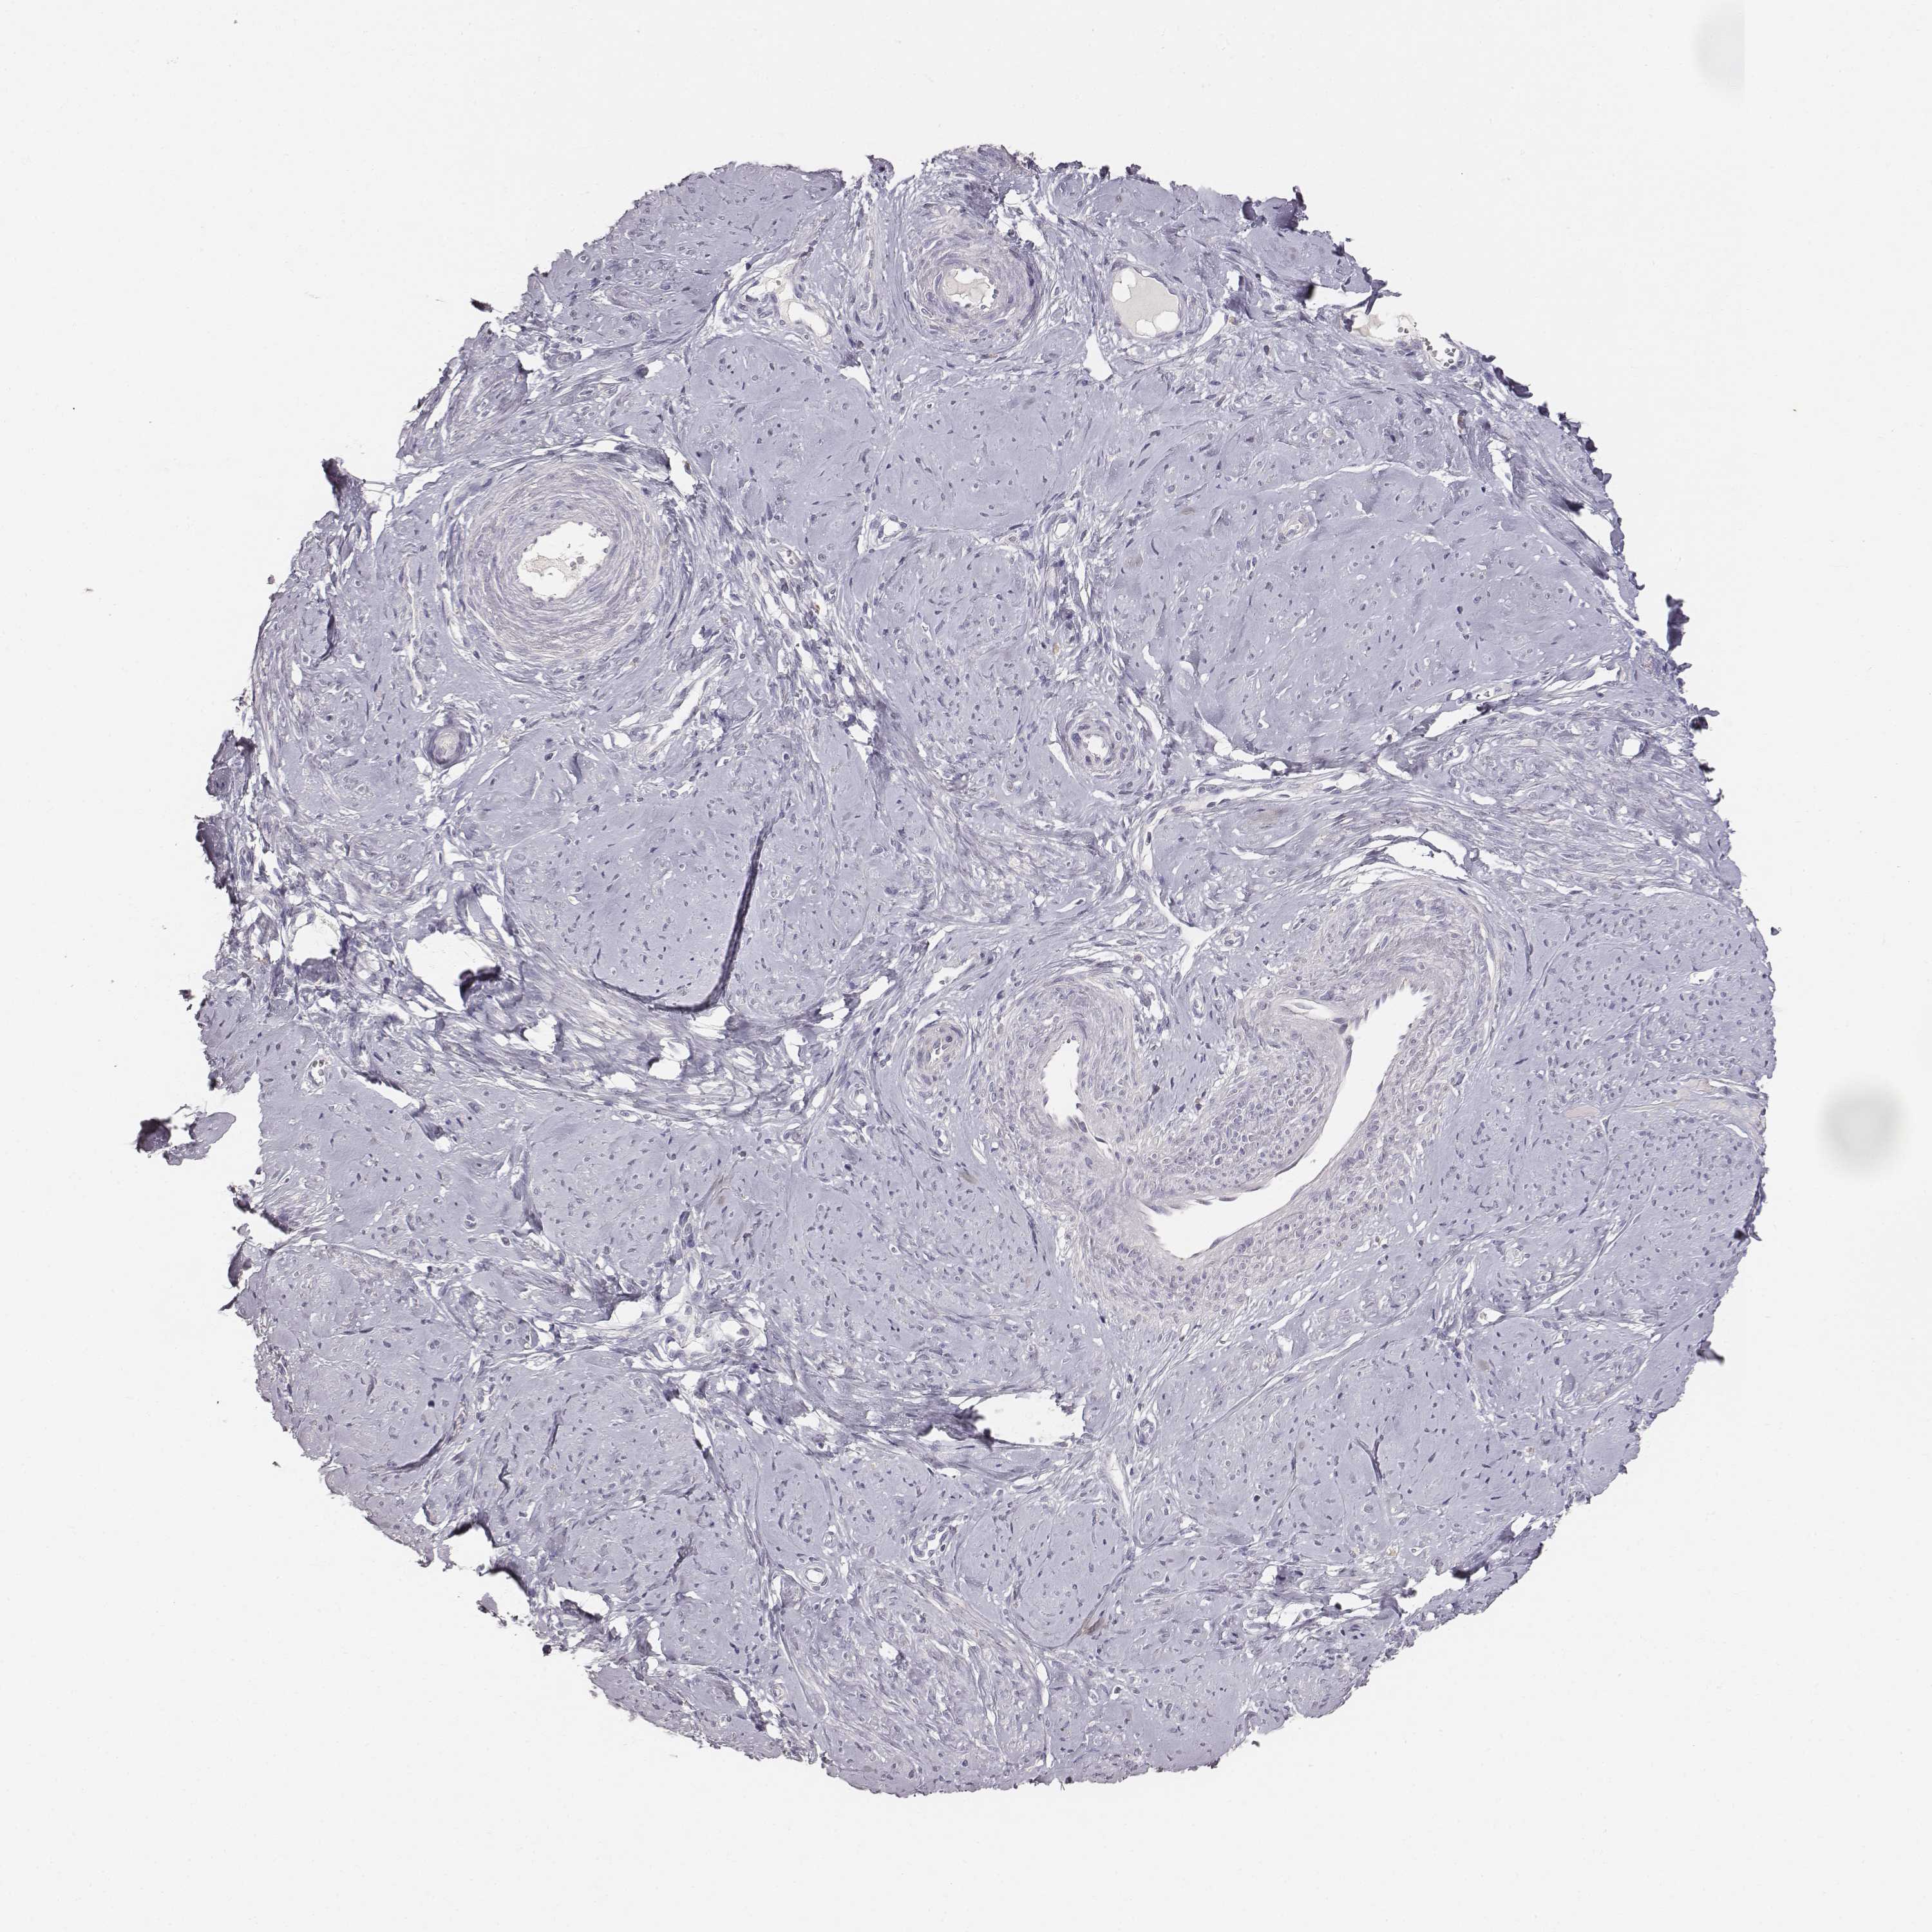
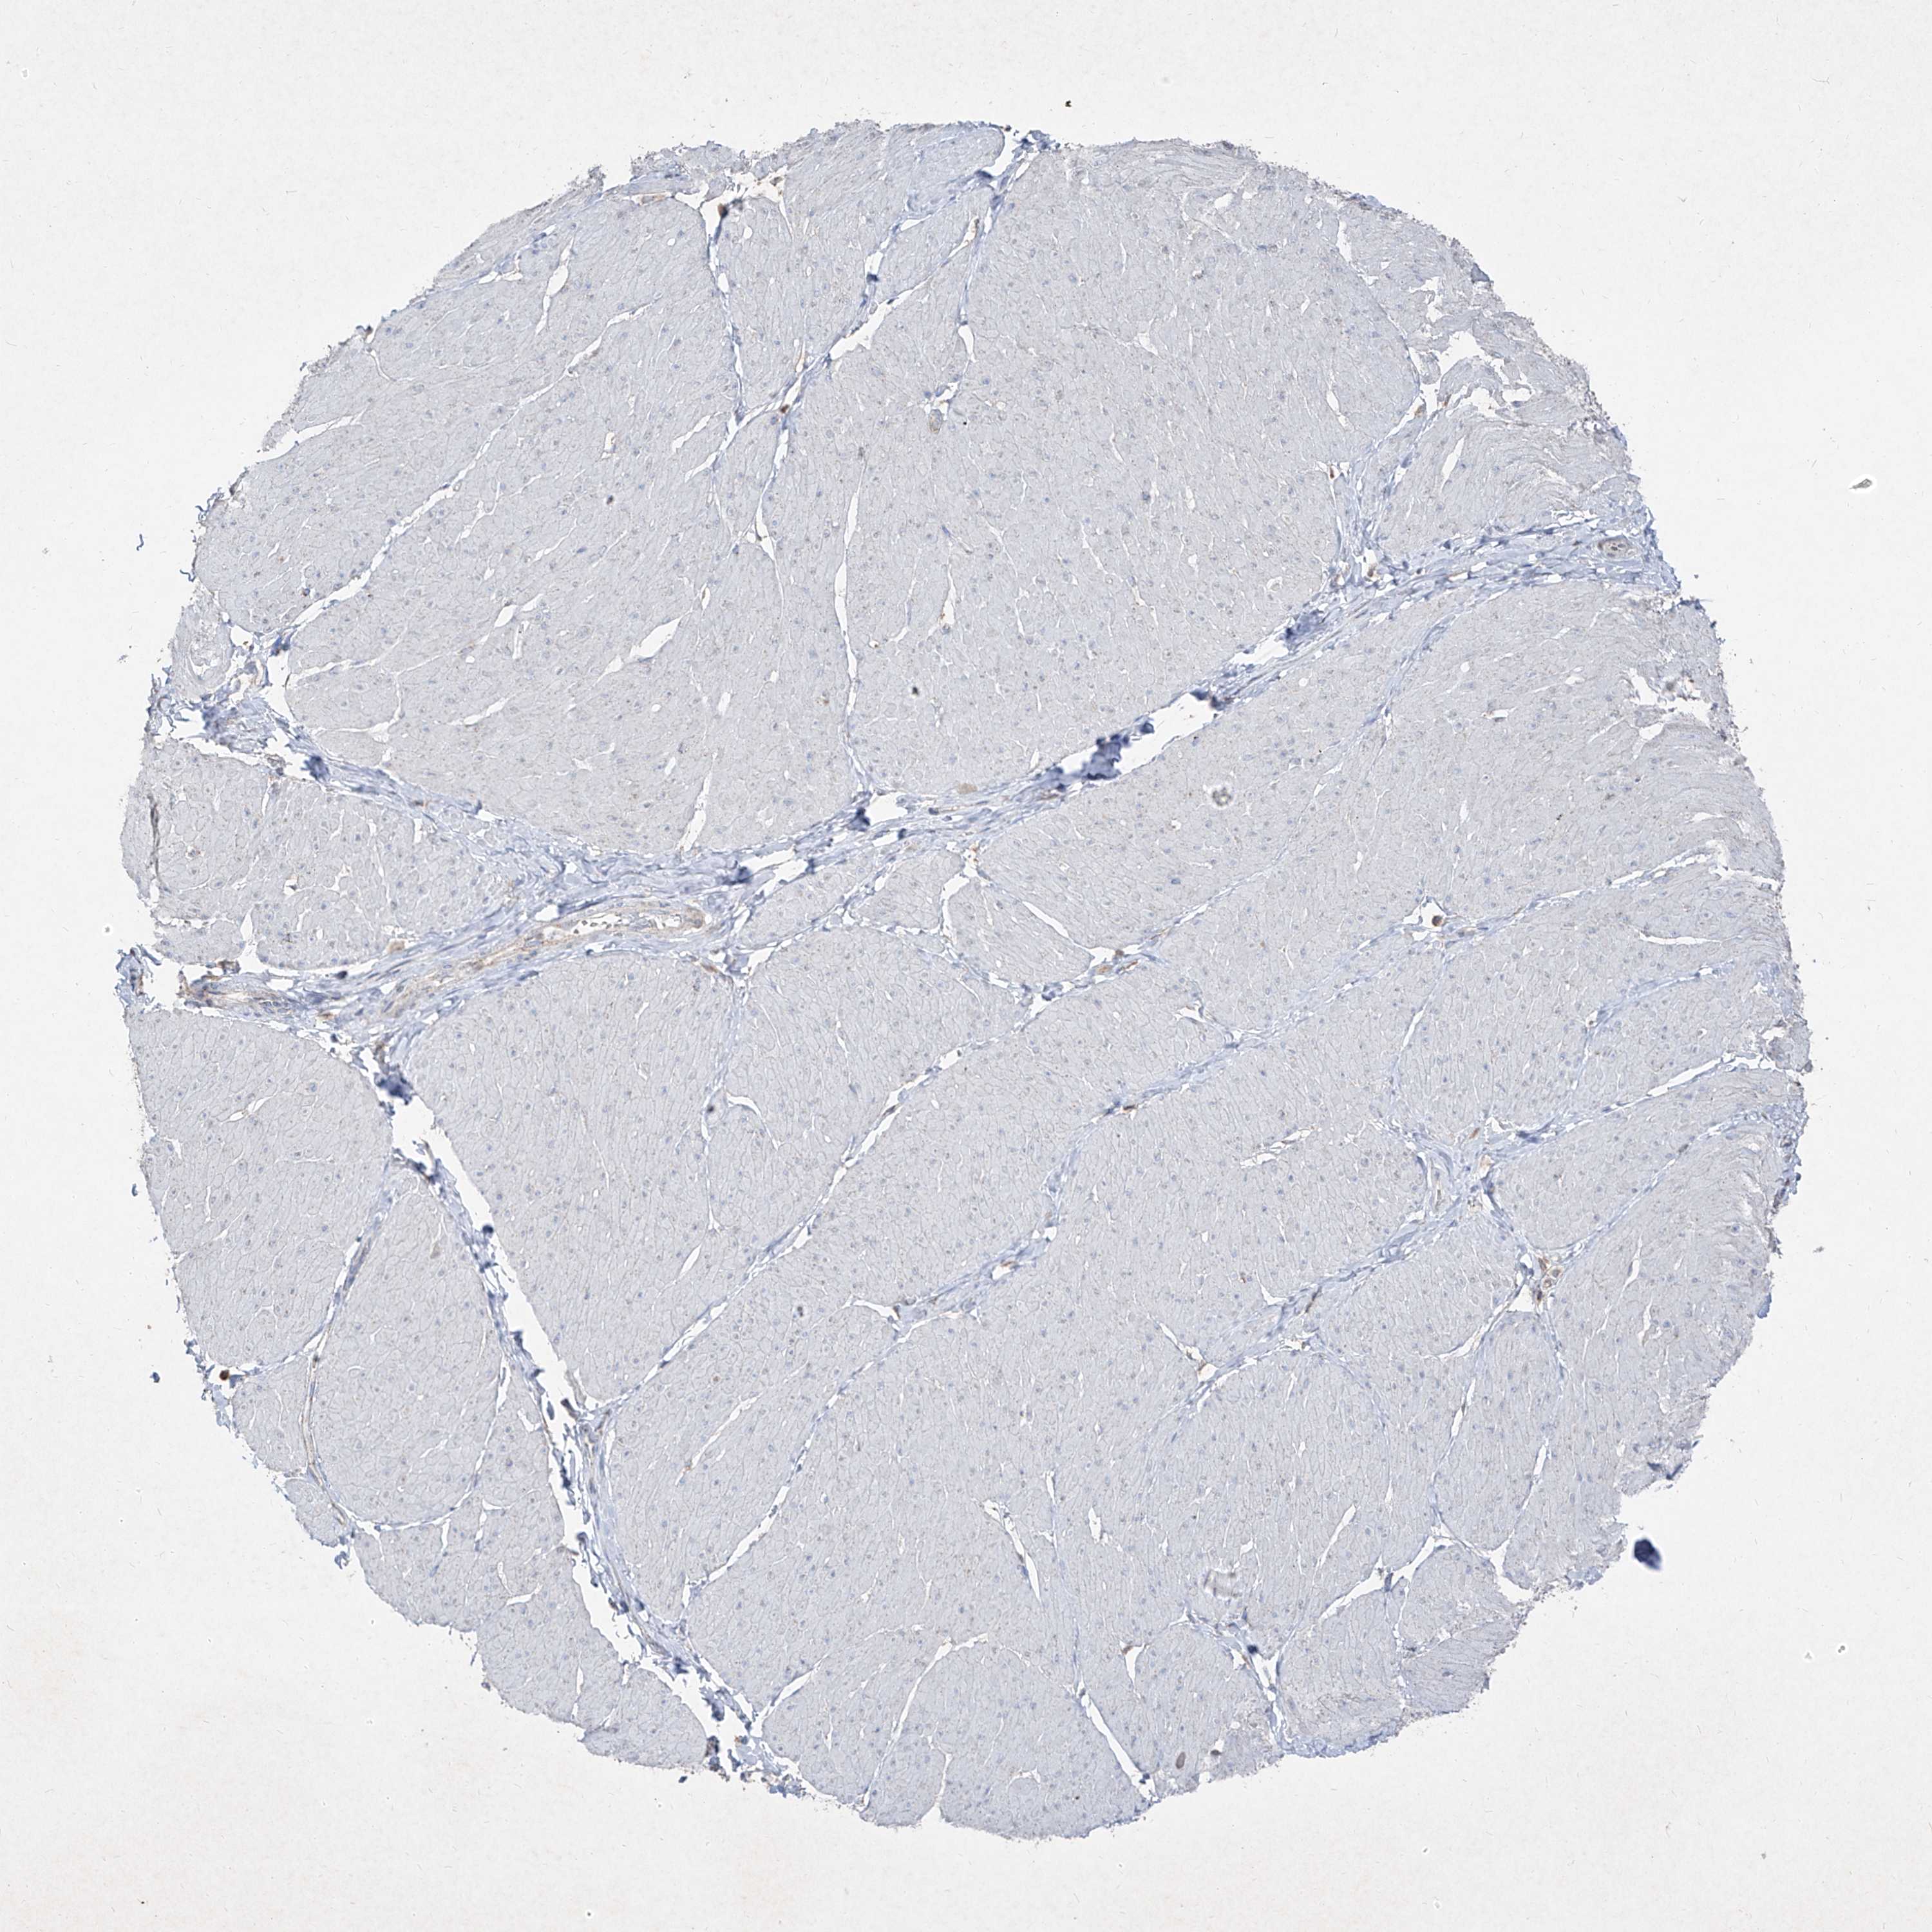
Antibody staining
Antibody HPA032026
Antibody HPA032027
Antibody CAB032516
Antibody CAB075749
Smooth muscle cells
SMOOTH MUSCLE - HPA RNA-seq
Average TPM
26.3
SMOOTH MUSCLE - GTEx RNA-seq
No GTEx RNA-seq analysis found for this gene / tissue
SMOOTH MUSCLE - FANTOM5 CAGE
Average Tags Per Million
19.9
FANTOM5 sample id
Sample description
Tags Per Million