TISSUE
CELL
PATHOLOGY
Antibody validation
Dictionary
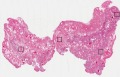
FALLOPIAN TUBE - Expression summary
Protein expression
RNA expression
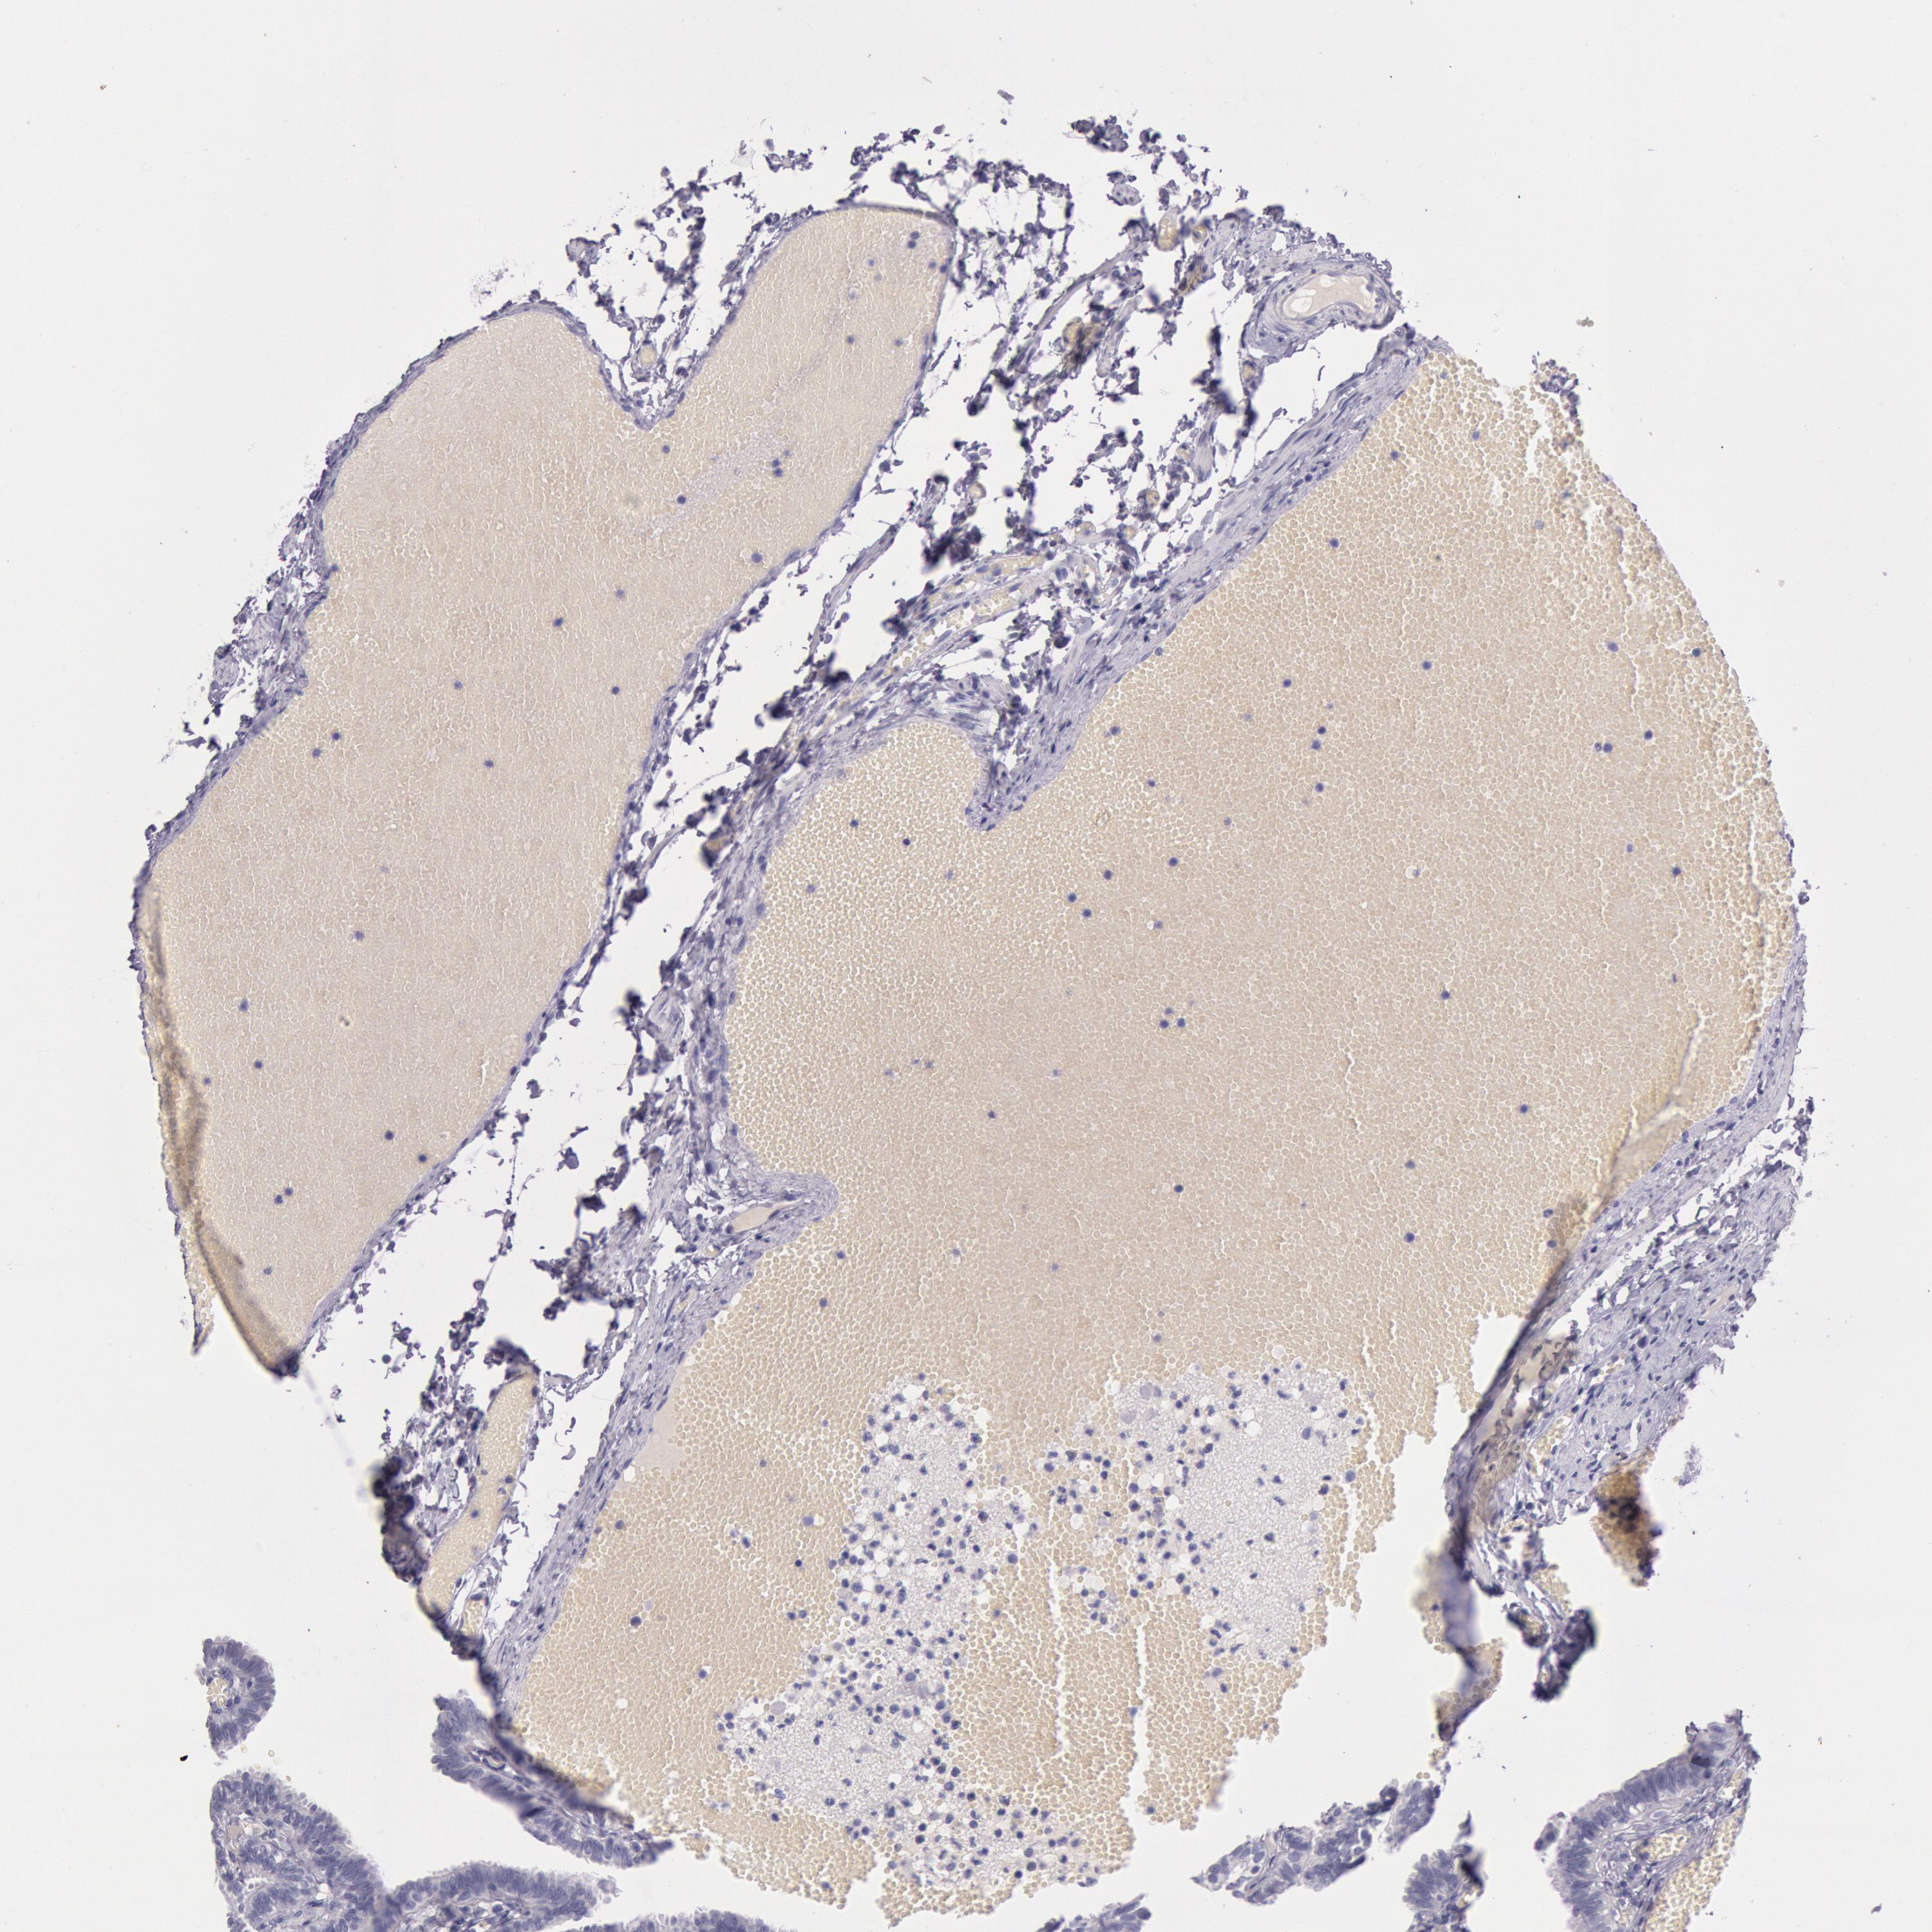
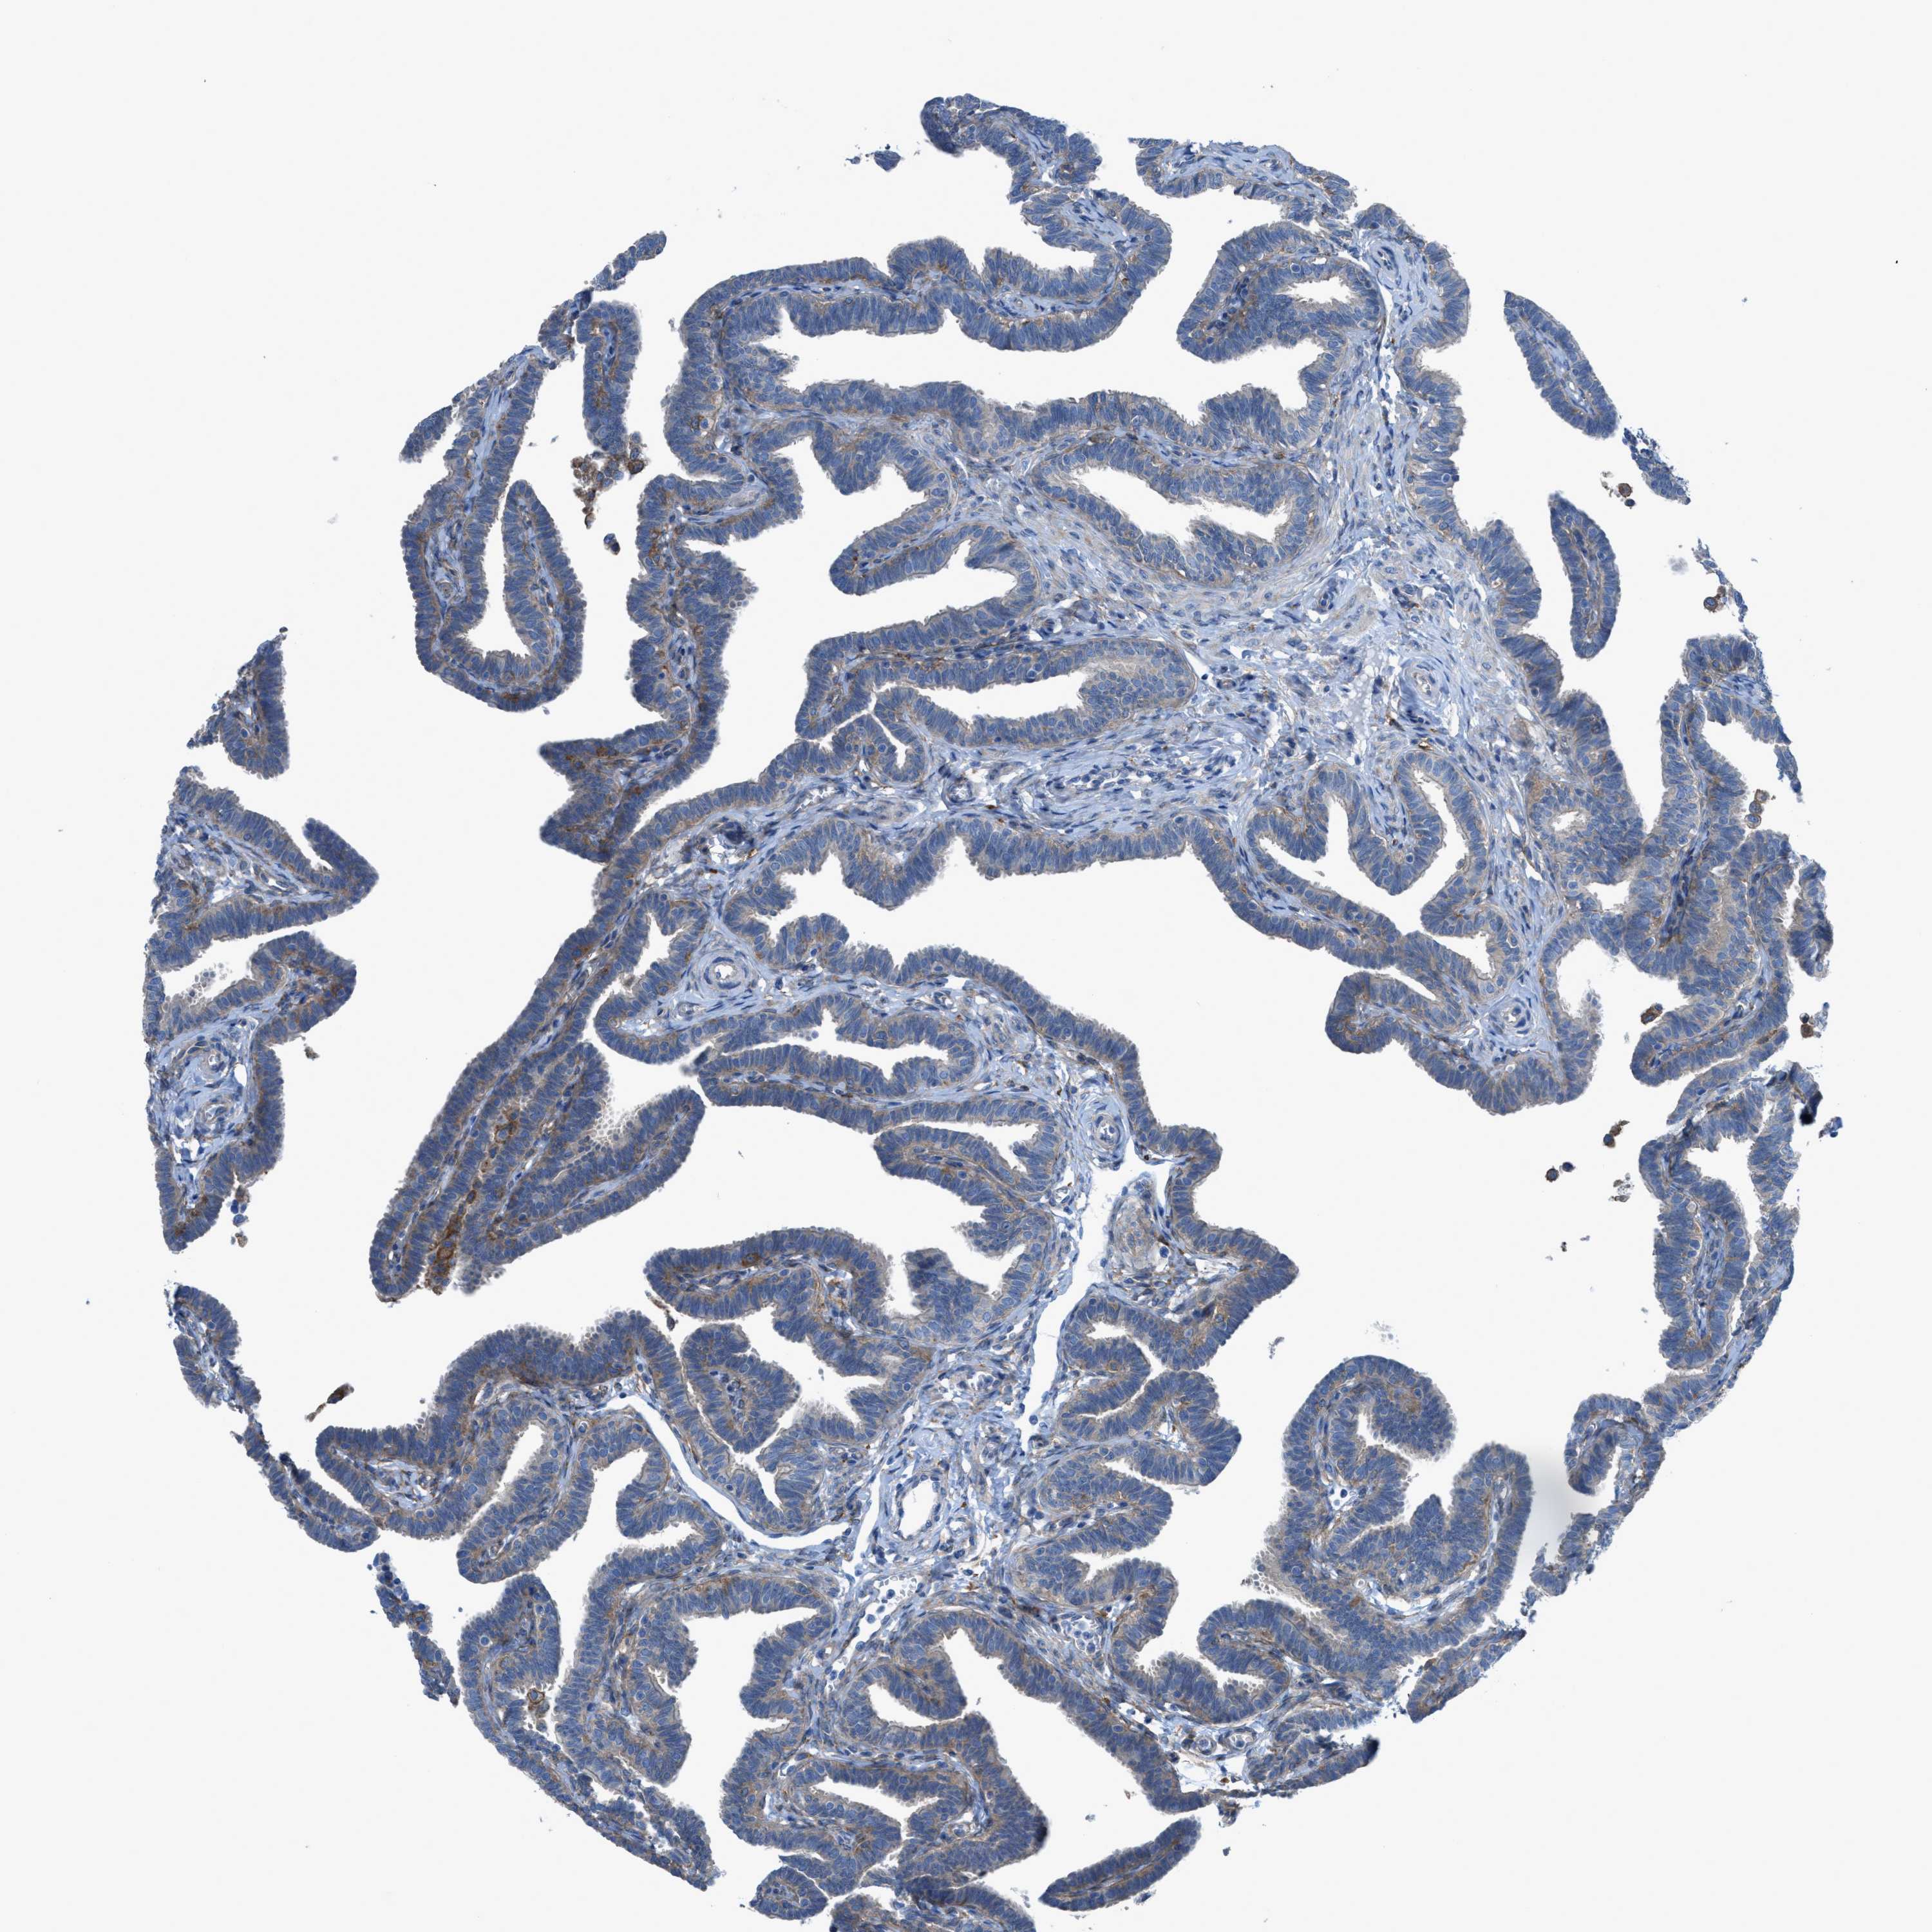
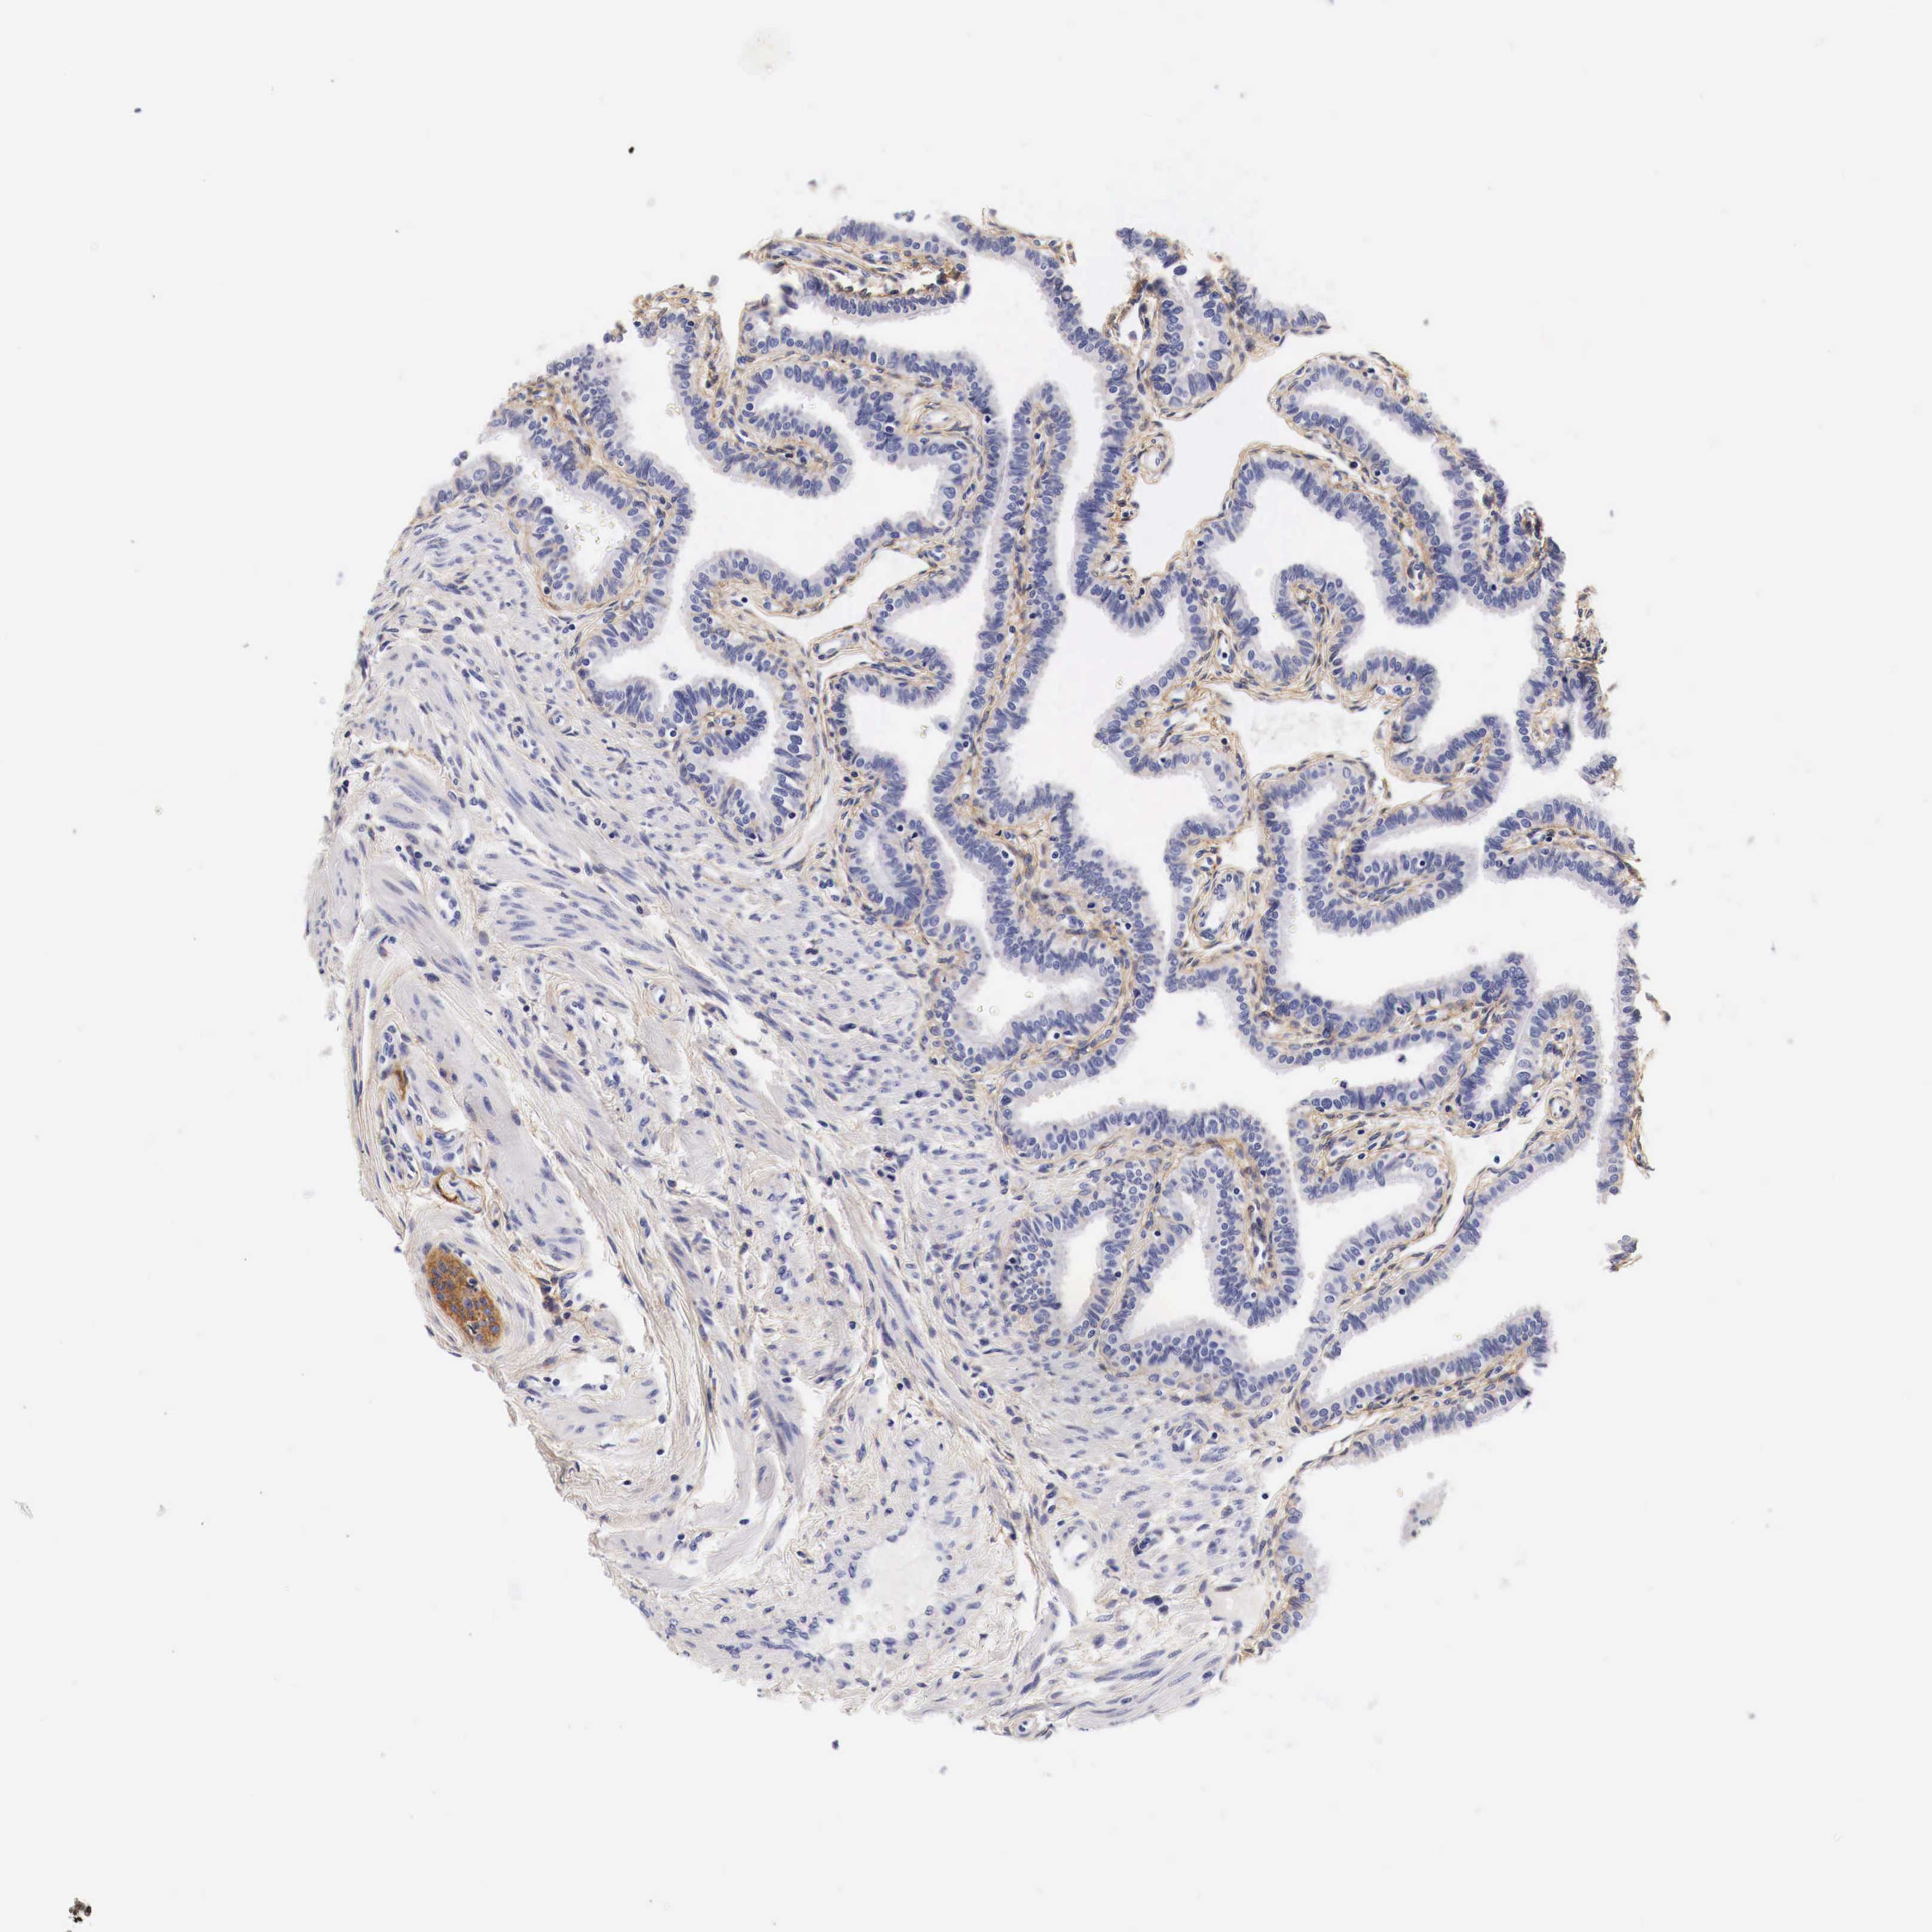
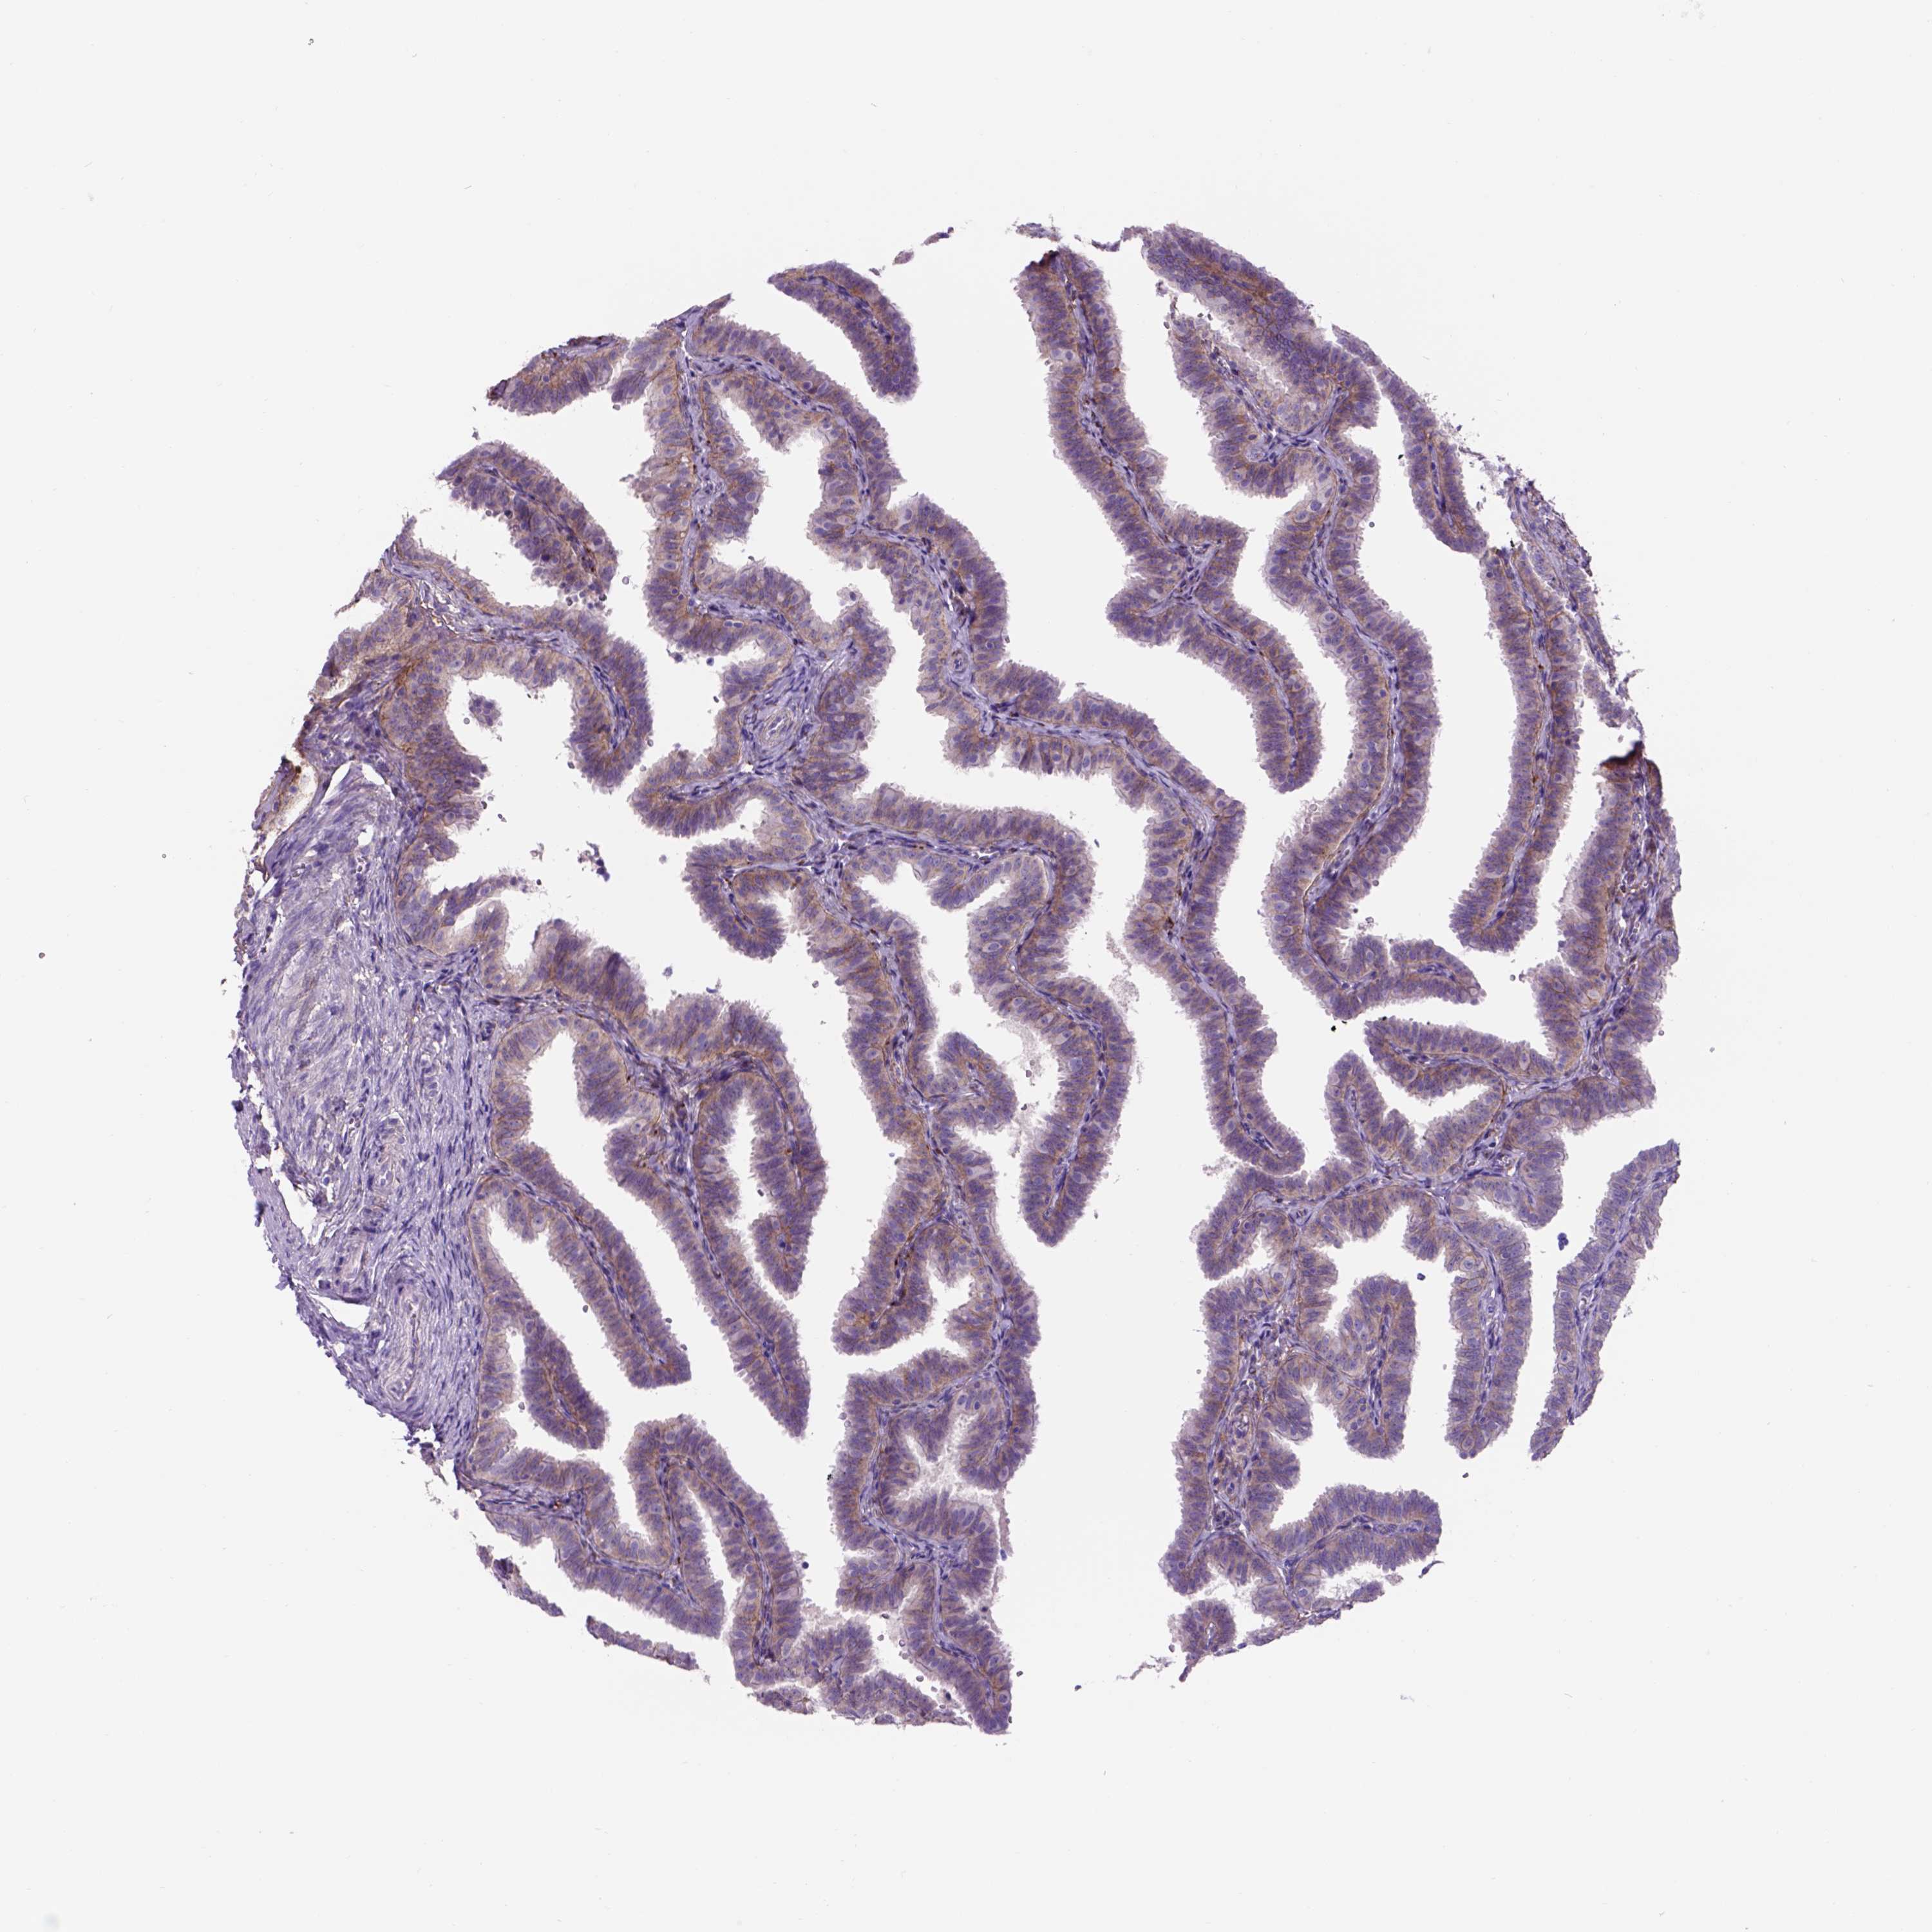
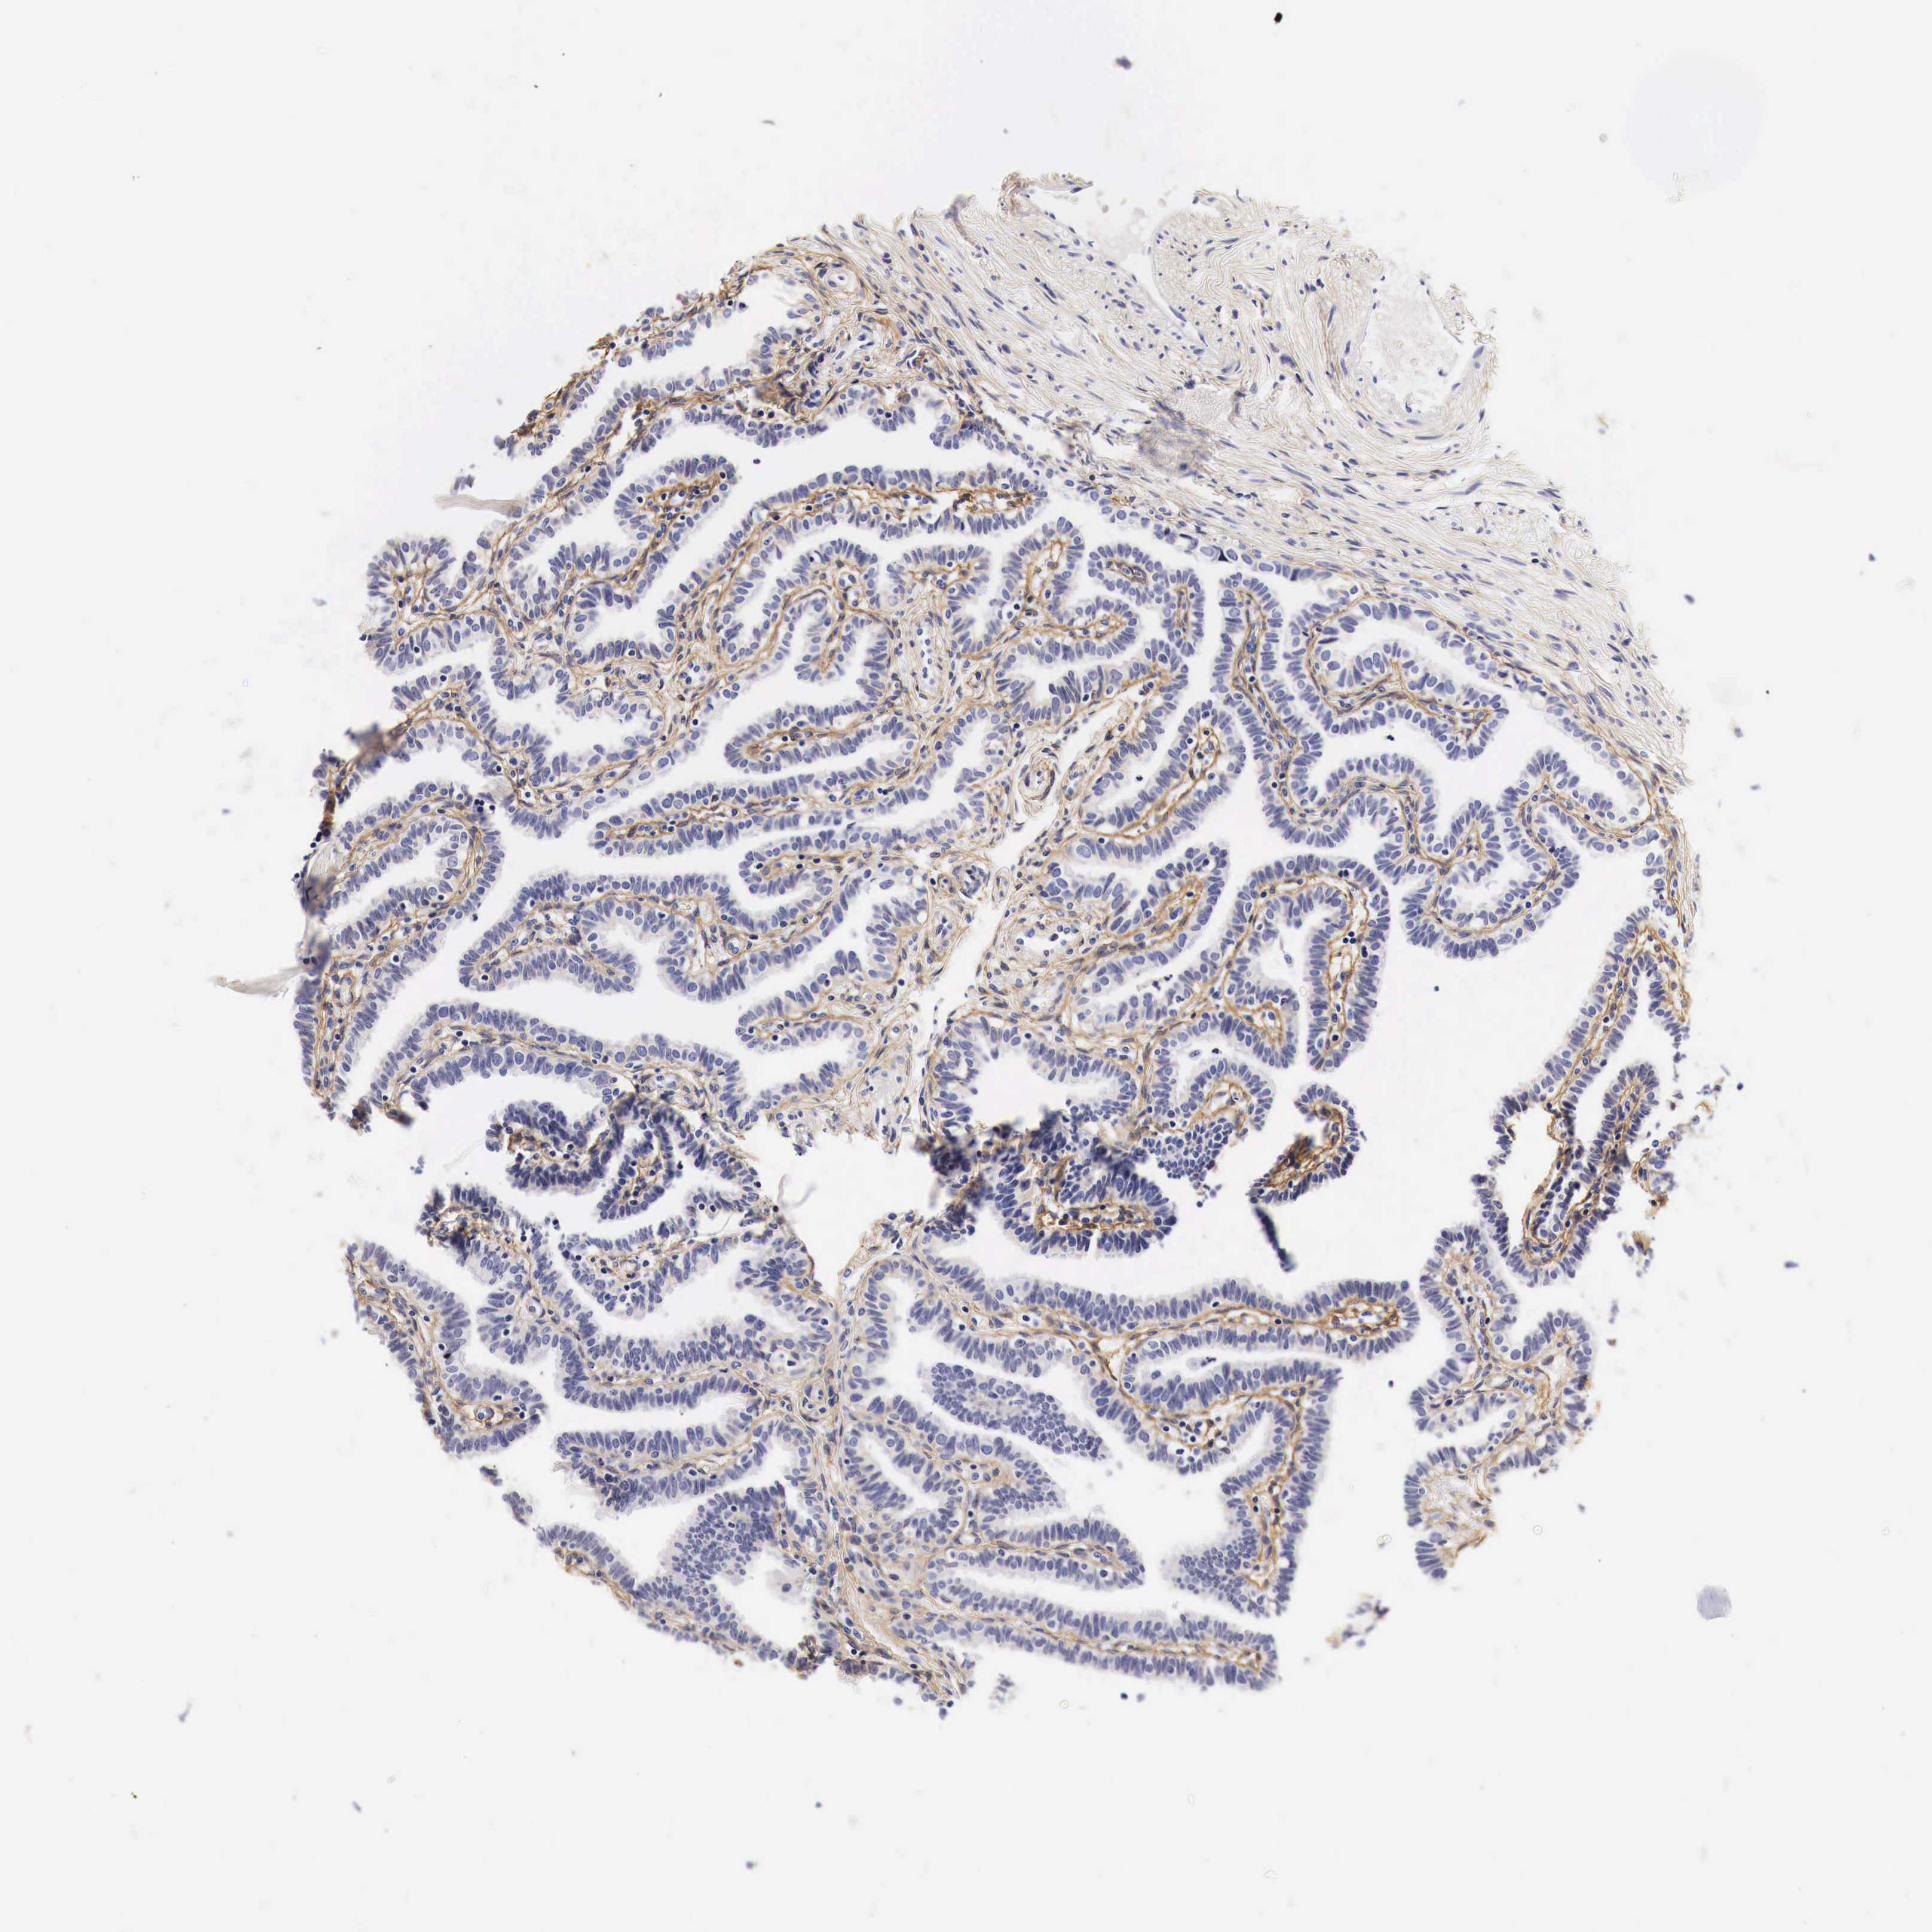
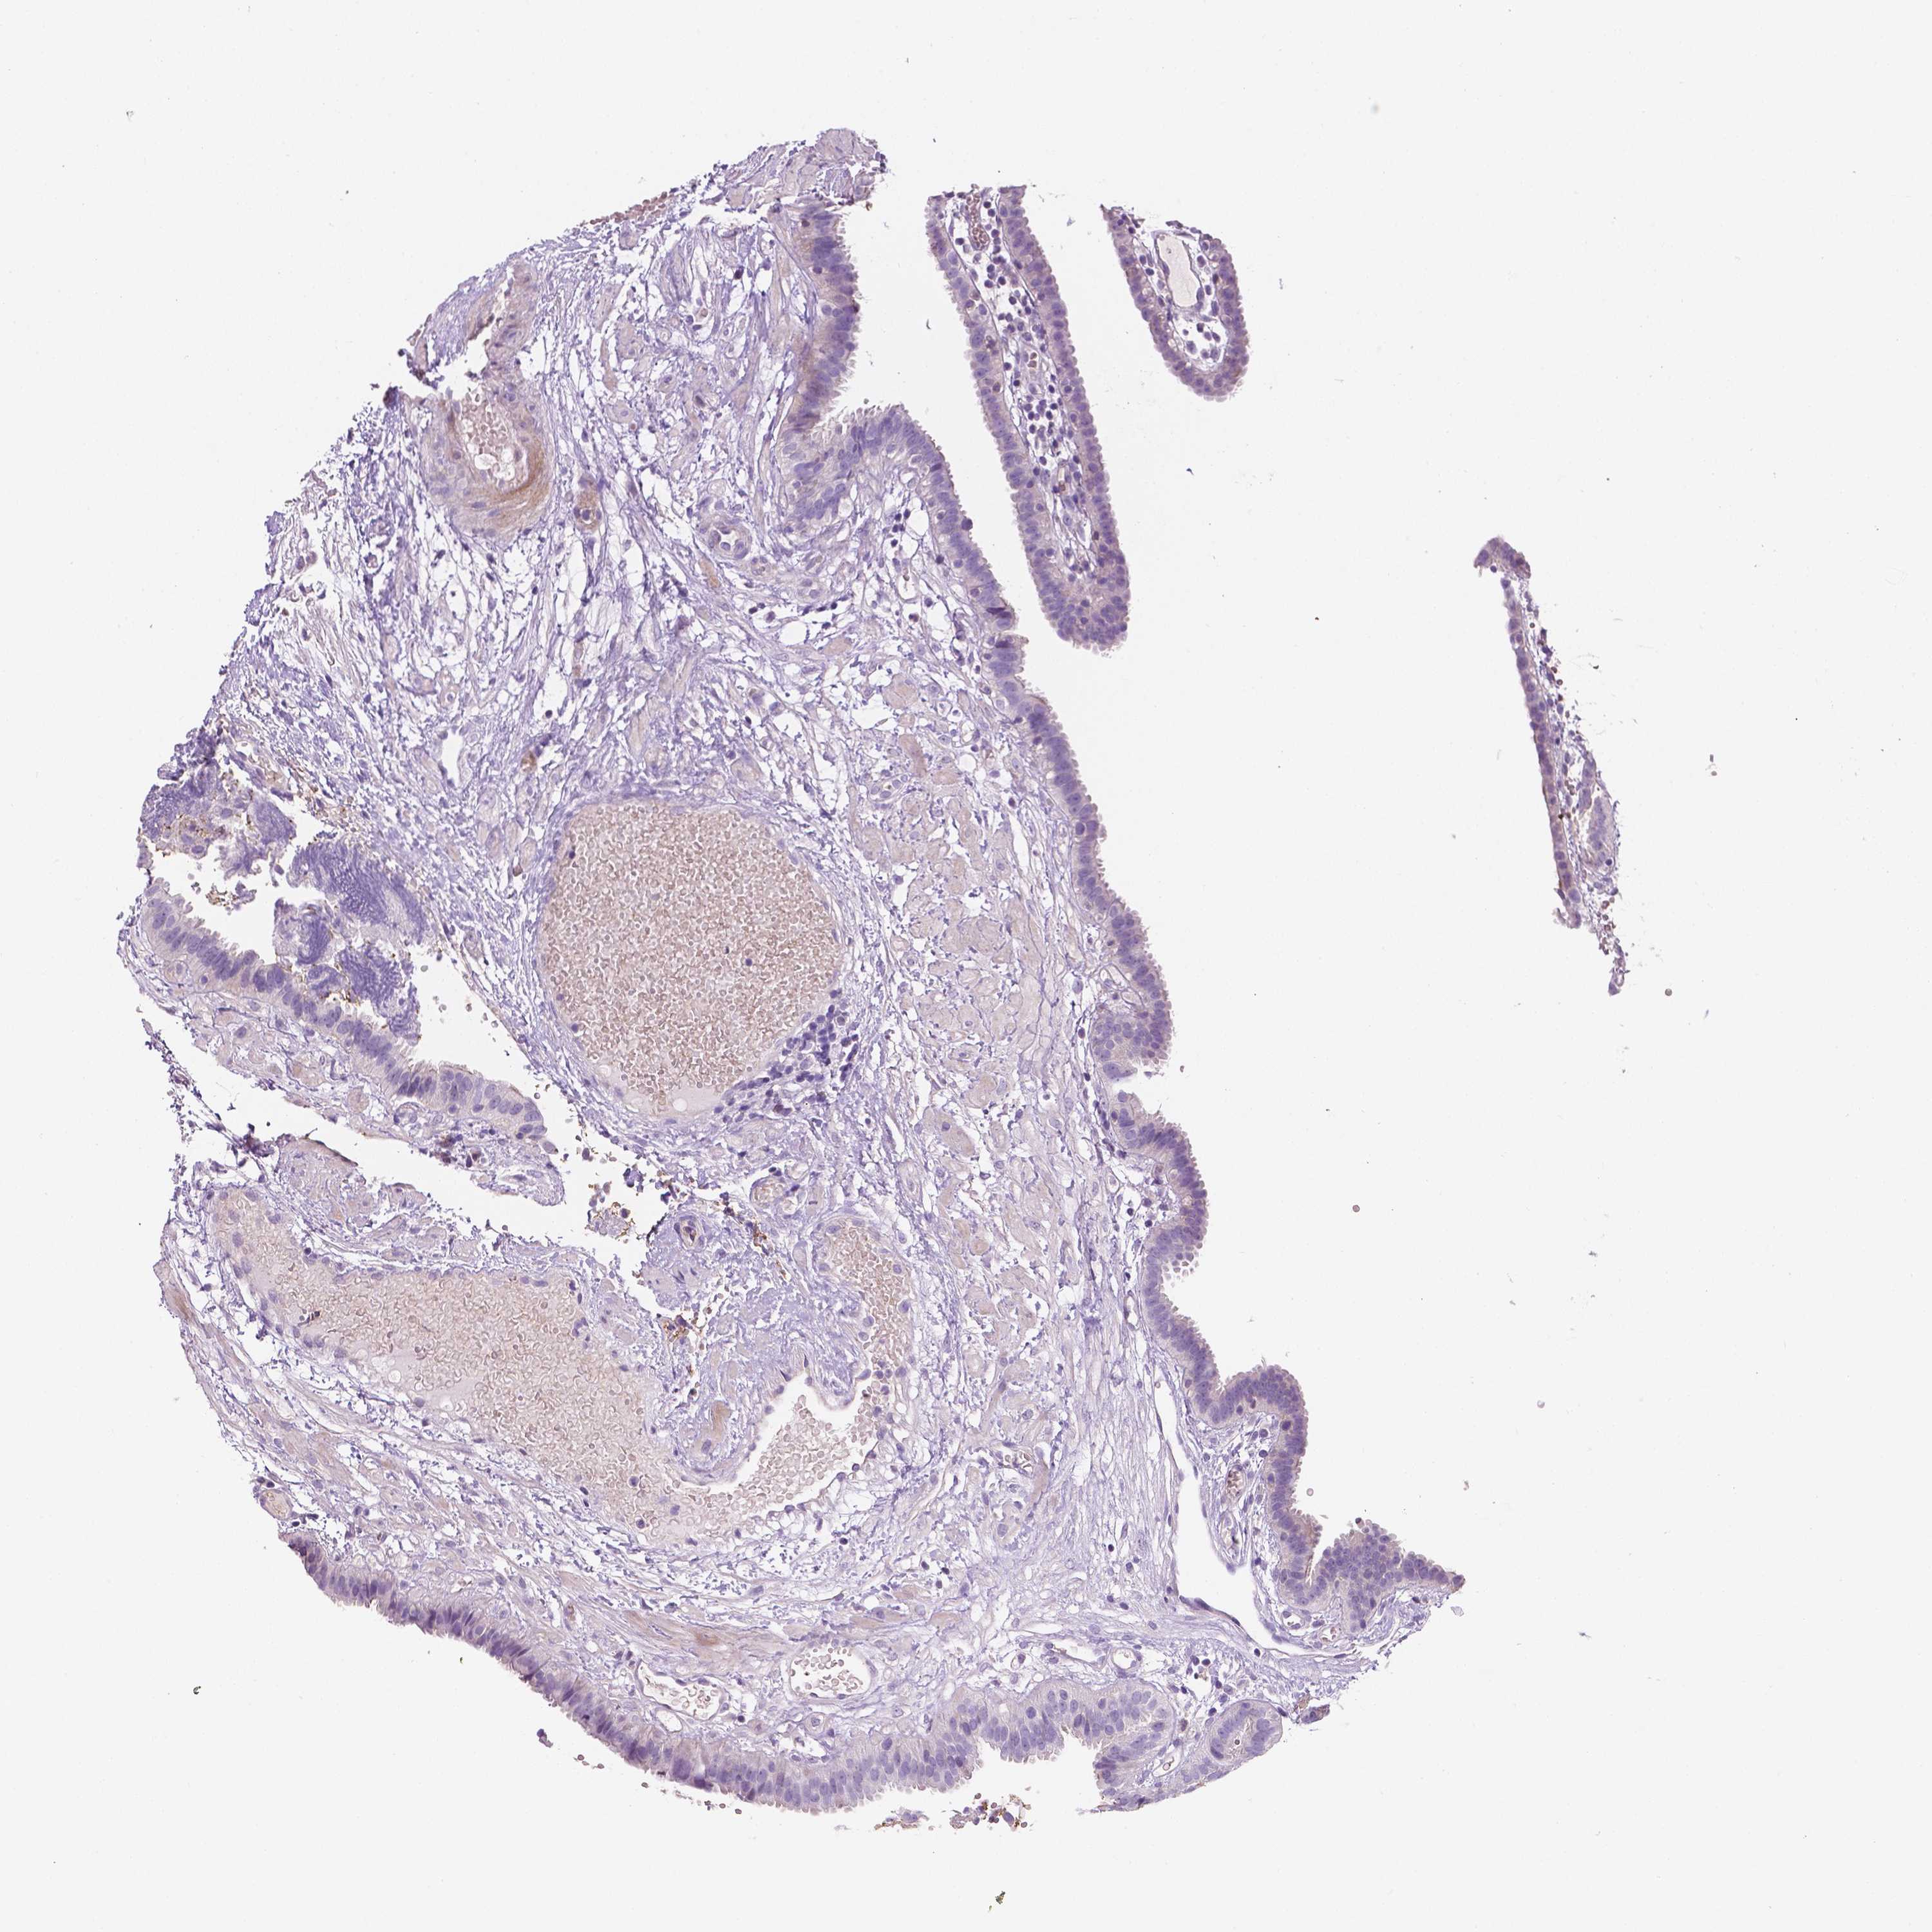
FALLOPIAN TUBE - Annotated protein expression
Annotated proteinexpression
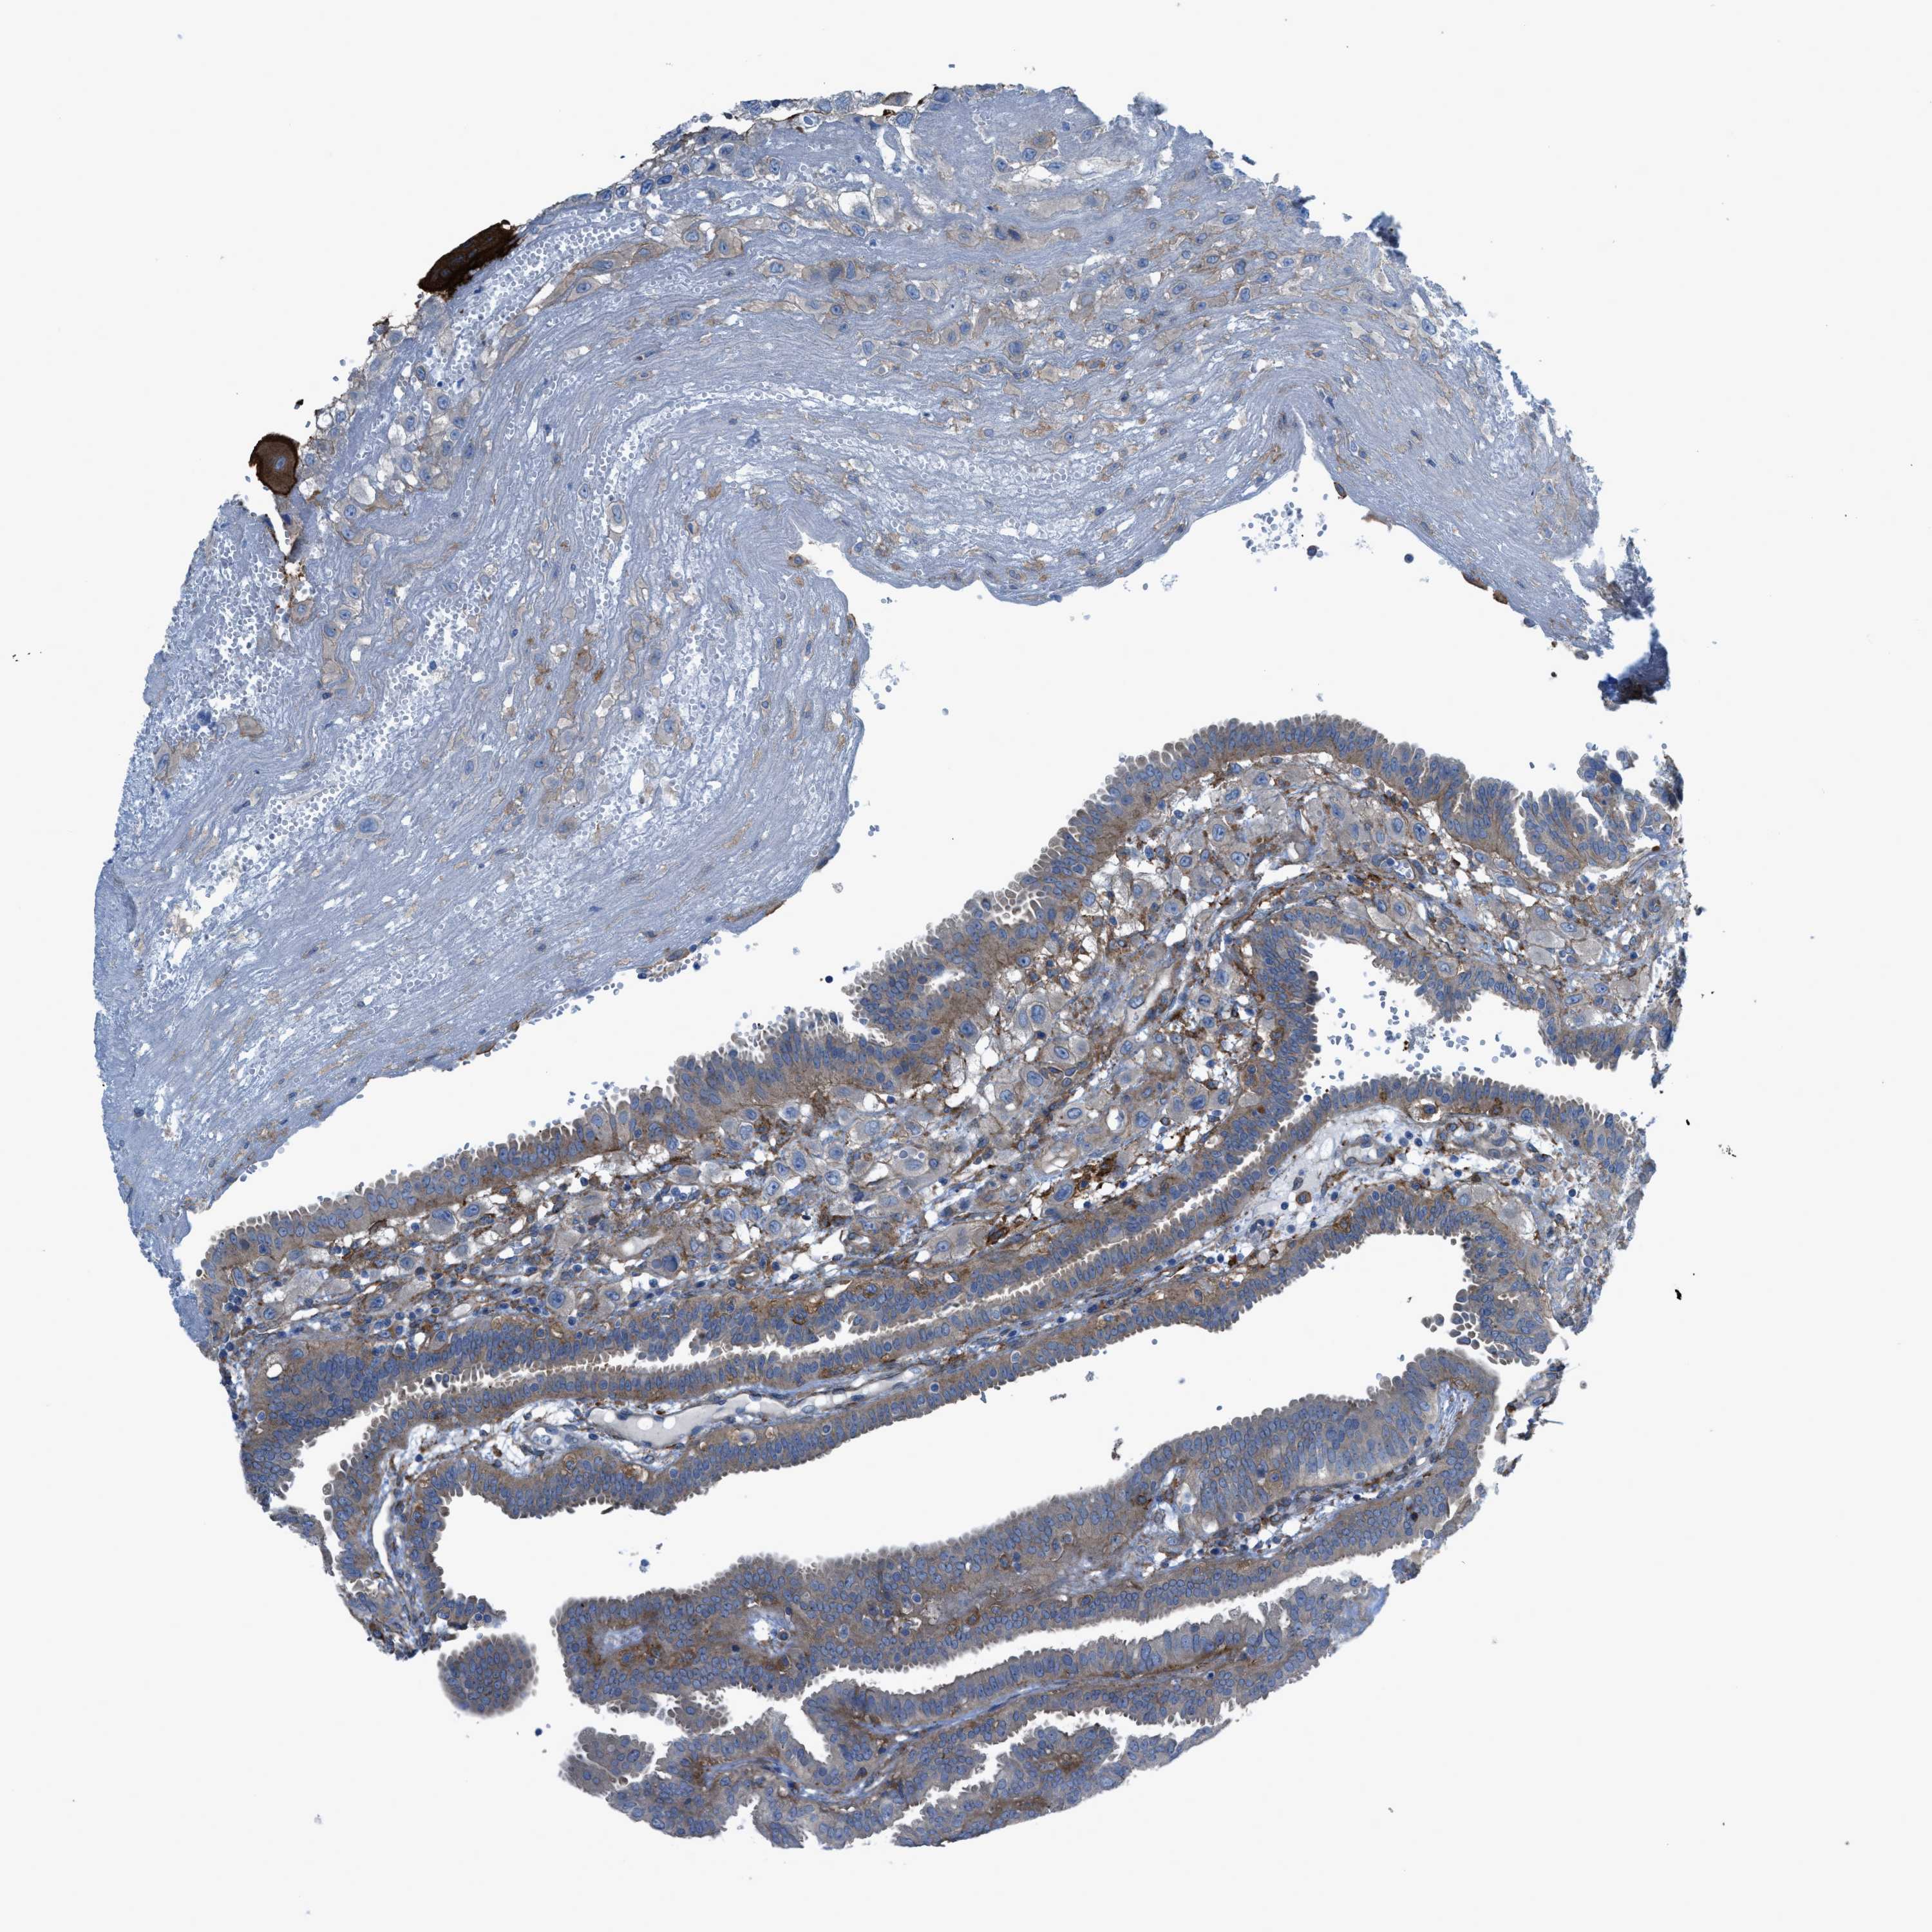
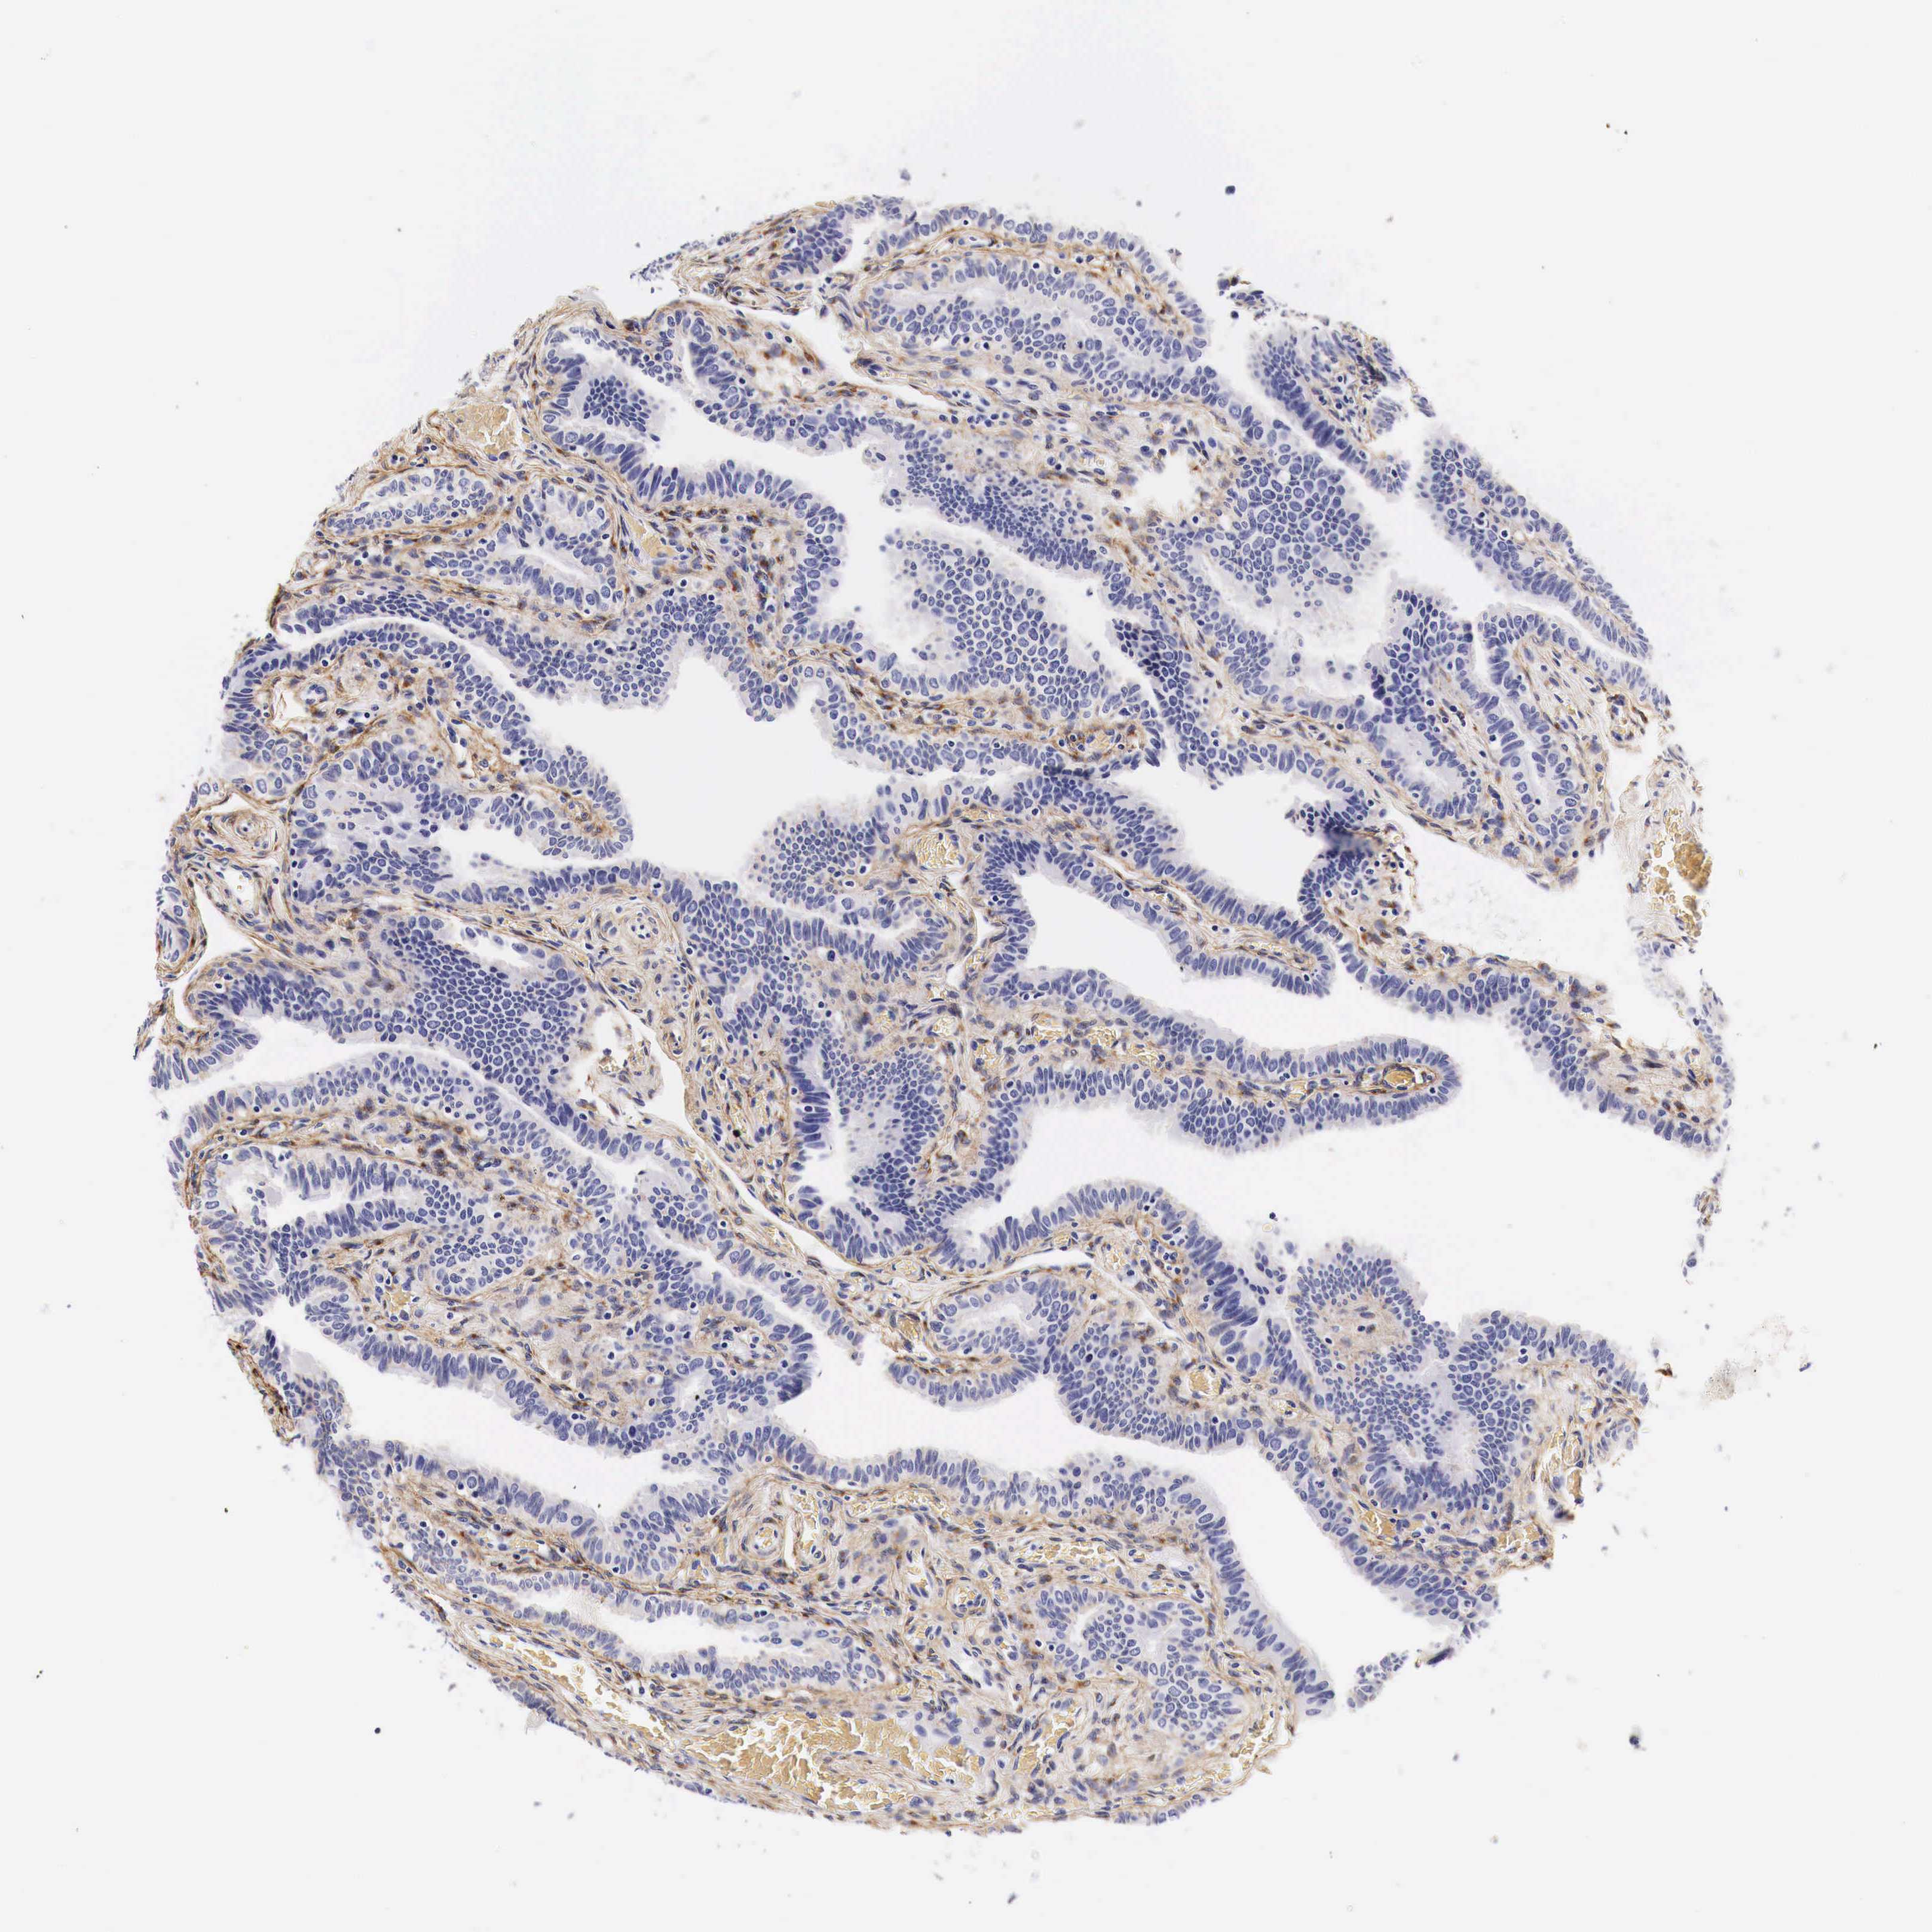
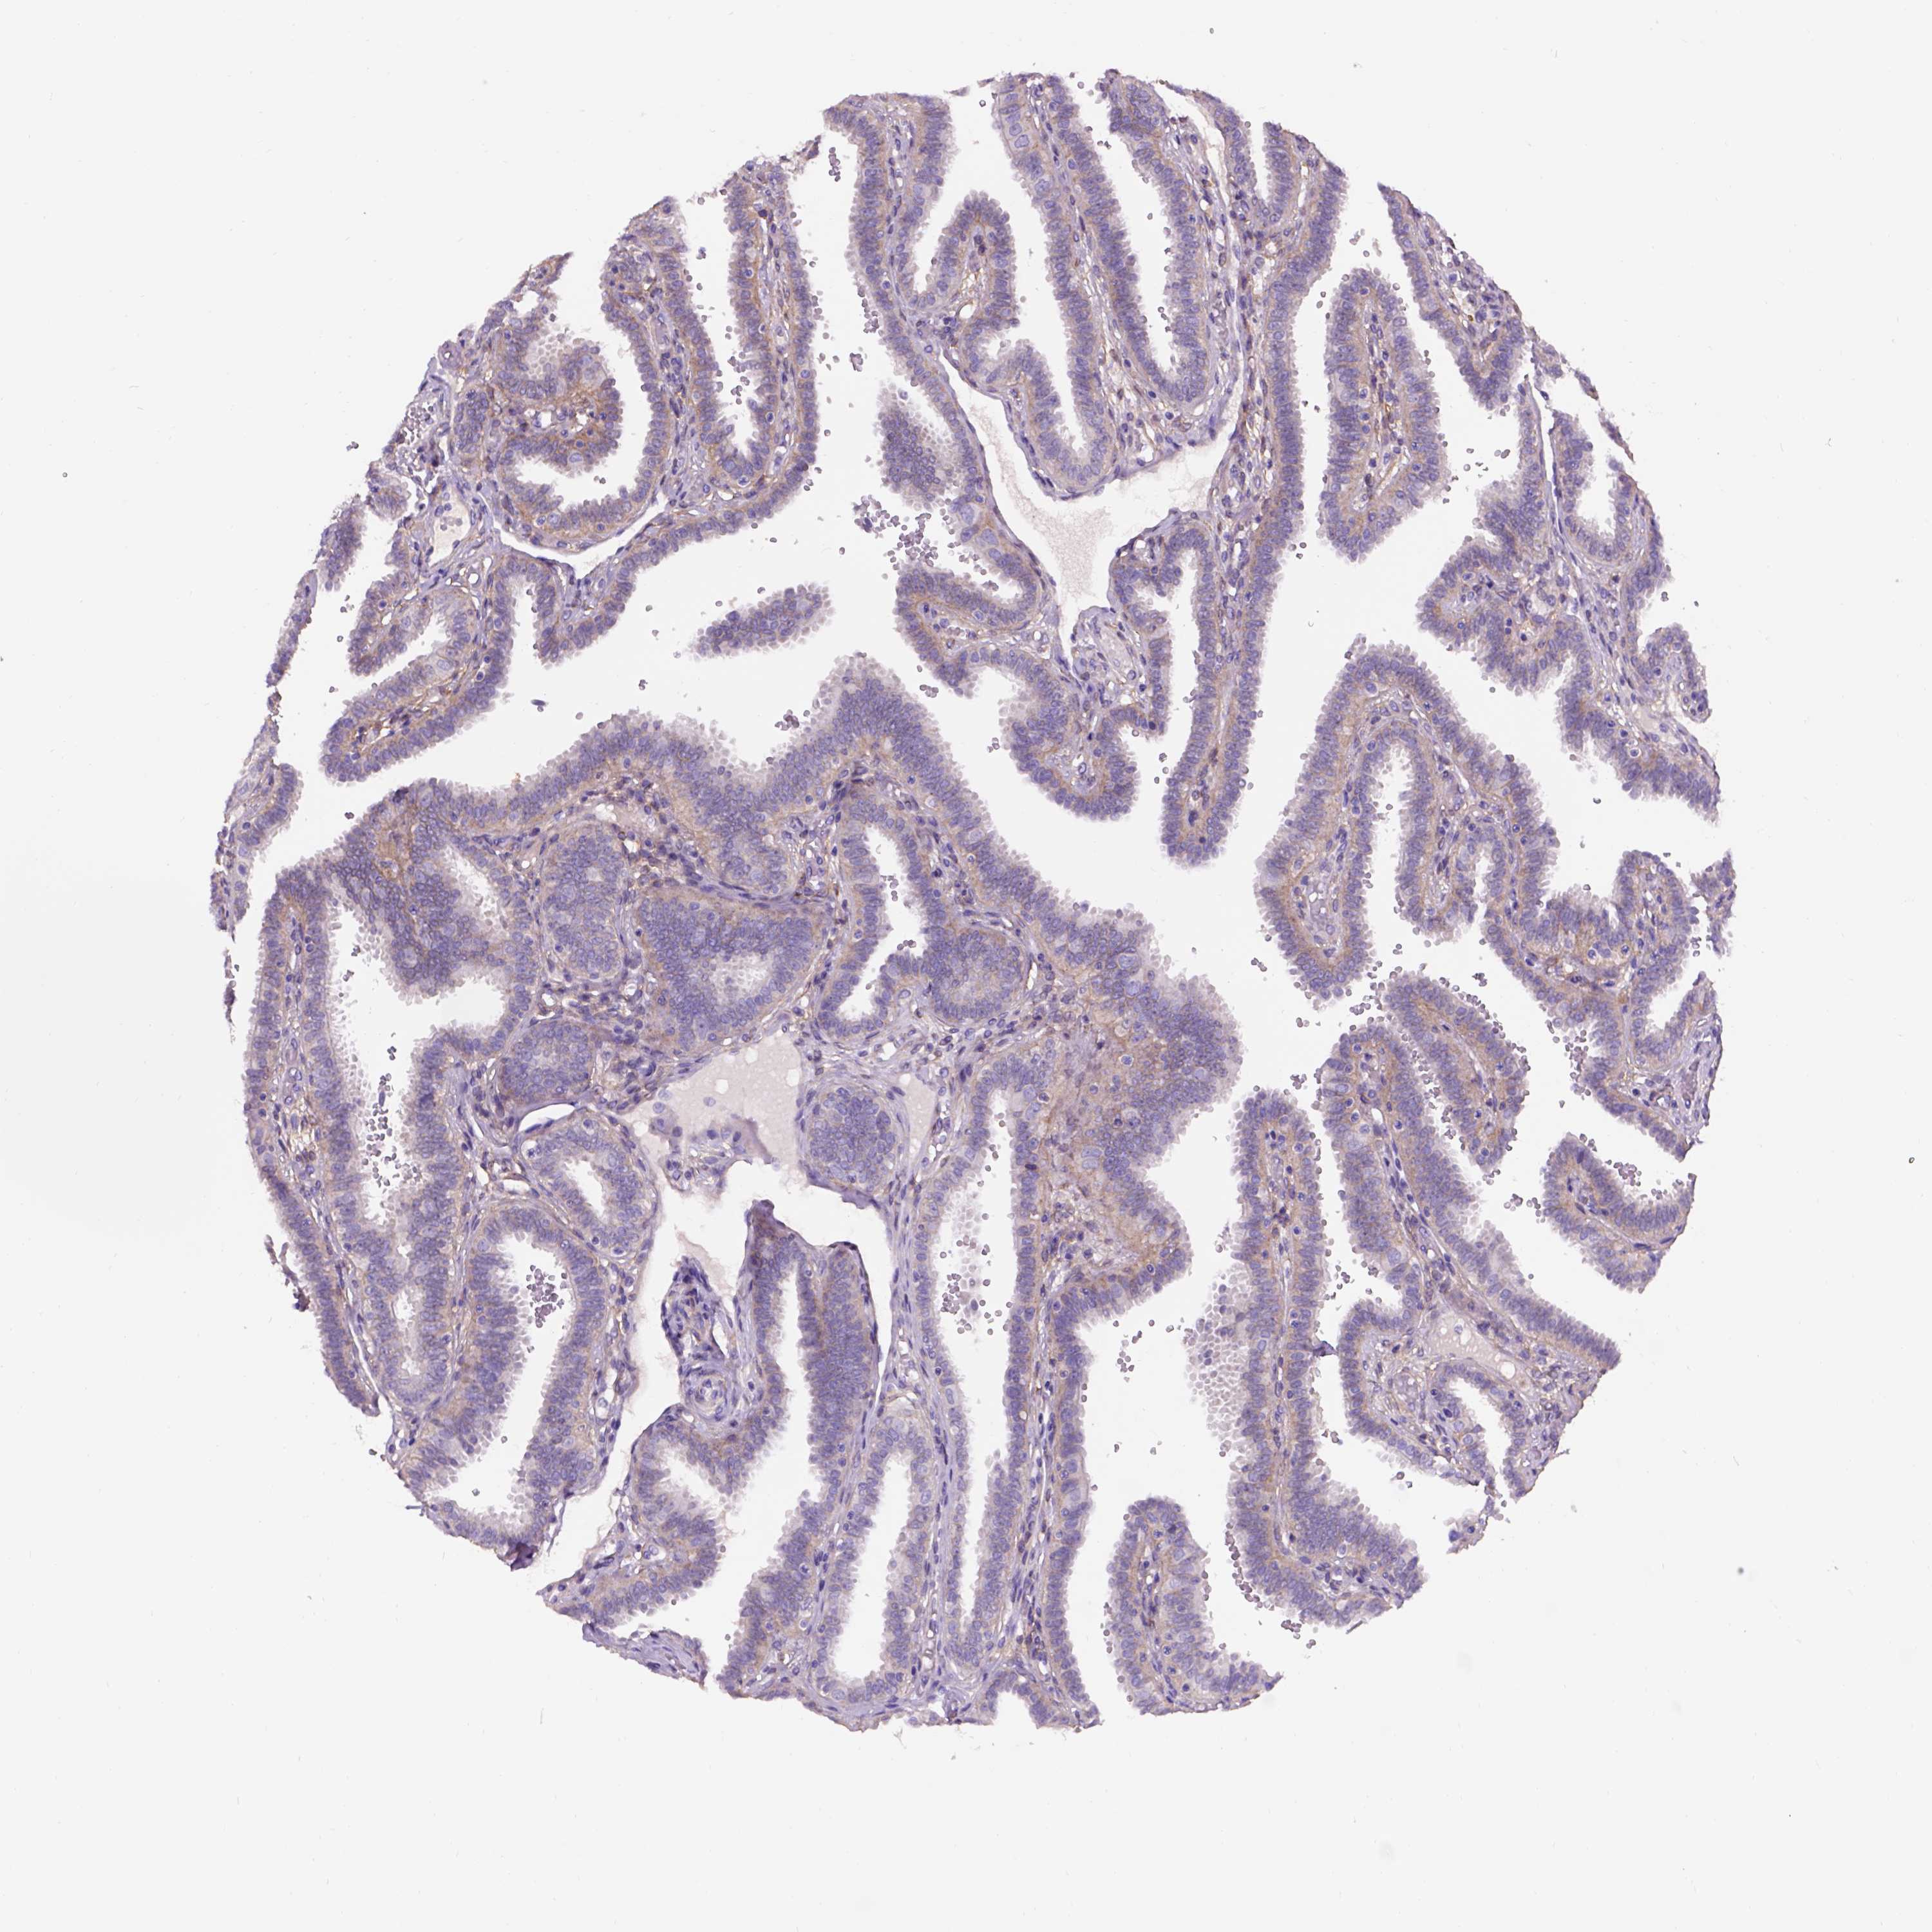
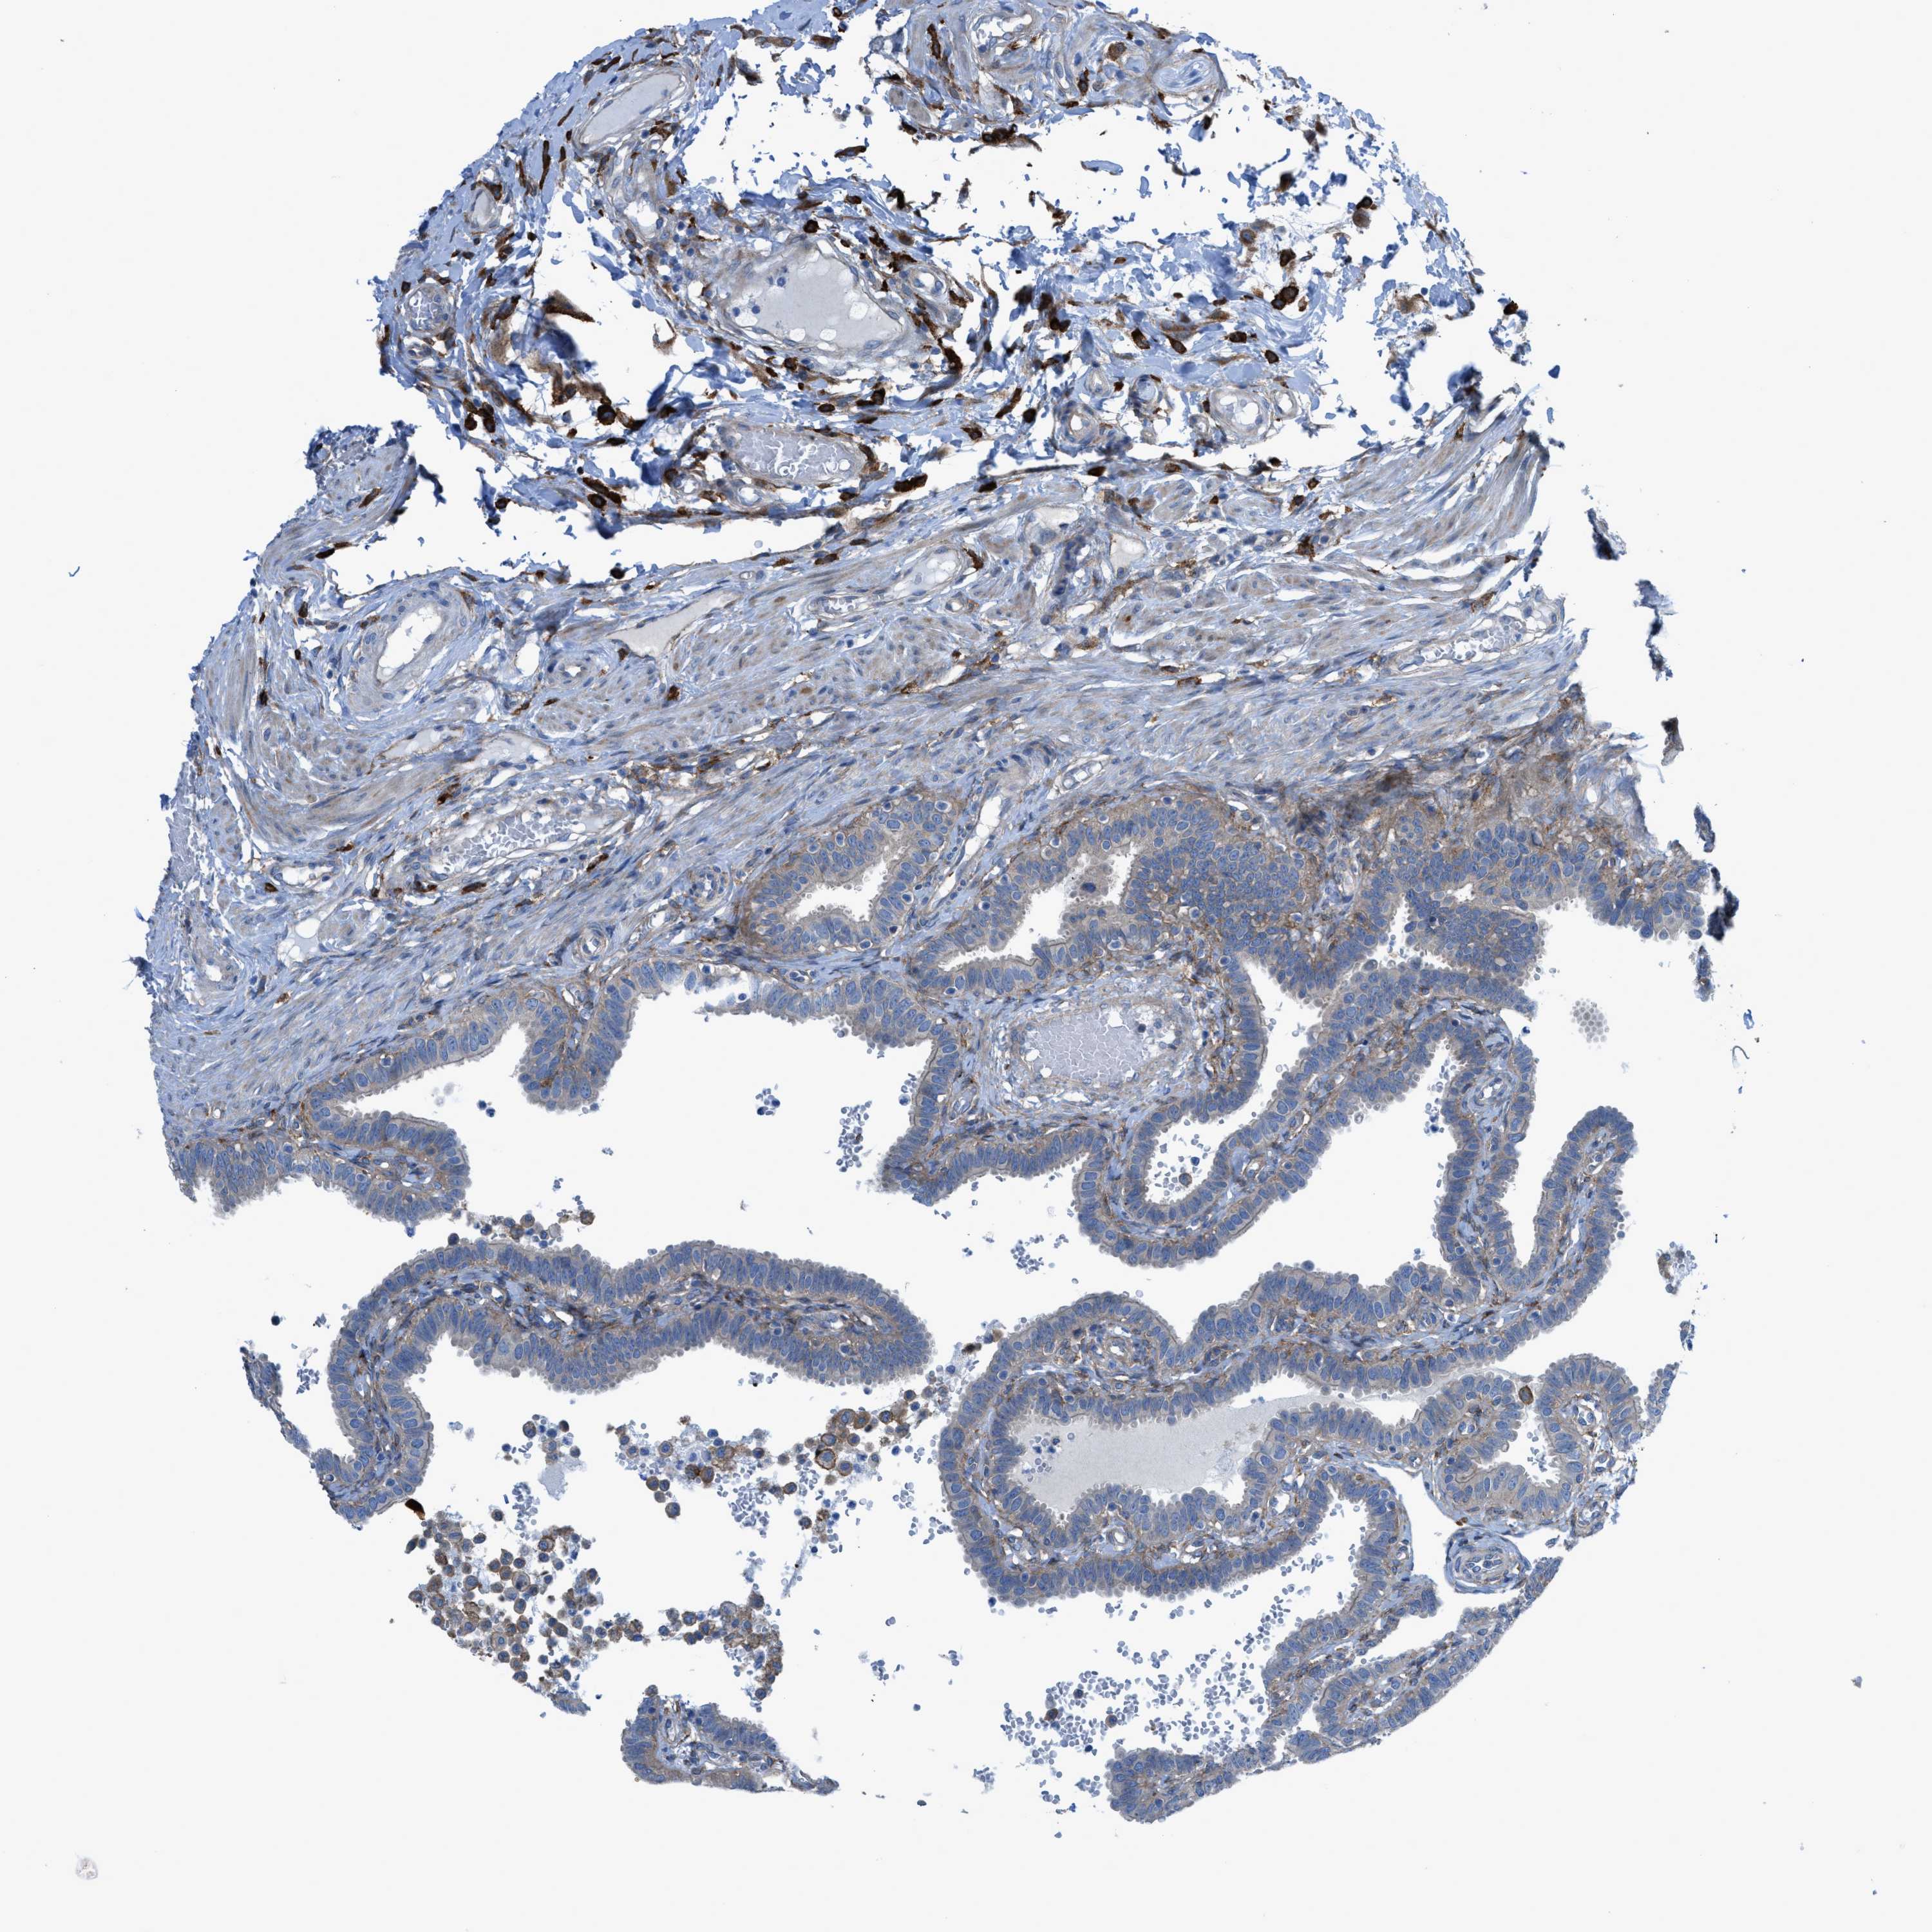
Antibody staining
Antibody HPA001200
Antibody HPA018530
Antibody CAB000035
Antibody CAB068186
Antibody CAB073534
Glandular cells
FALLOPIAN TUBE - HPA RNA-seq
Average TPM
19.9
FALLOPIAN TUBE - GTEx RNA-seq
Average RPKM
10.4
GTEx sample id
Sample description
RPKM
FALLOPIAN TUBE - FANTOM5 CAGE
No Fantom CAGE analysis found for this gene / tissue