We use cookies to enhance the usability of our website. If you continue, we'll assume that you are happy to receive all cookies. More information. Don't show this again.
Fields »
 

Field

Term
Gene name

Class

Subclass

Chromosome

External id

In atlas

Reliability

Reliability

Reliability

Validation

Method

Validation

Method

Validation

Method

Validation

Location

Searches

Tissue

Cell type

Expression

Tissue

Specificity

Cell line

Specificity

Cancer

Specificity

Tissue

Detectable

Cell line

Detectable

Cancer

Detectable

Cancer

Prognosis

Category

Score

Score

Score

Antibodies

Column


ABOUT
HELP
BLOG
  • THE HUMAN PROTEOME
  • THE HUMAN TISSUES
  • THE HUMAN CELL
  • HUMAN PATHOLOGY
  • PROTEIN CLASSES
  • PROTEIN EVIDENCE
    • NEWS
    • BLOG
    • EVENTS
    • PRESS ROOM
    • LEARN
    • DICTIONARY
    • METHODS
    • CELL LINES
  • THE PROJECT
  • INTRODUCTION
  • ORGANIZATION
  • PUBLICATIONS
  • PUBLICATION DATA
  • ANTIBODY SUBMISSION
  • ANTIBODY AVAILABILITY
  • LINKS
  • CONTACT
  • TECHNICAL DATA
  • ANTIBODY VALIDATION
  • ASSAYS & ANNOTATION
  • DISCLAIMER
  • DOWNLOADABLE DATA
  • HELP & FAQ
  • LICENCE & CITATION
  • PRIVACY STATEMENT
  • RELEASE HISTORY
ABCA6
  • TISSUE

  • CELL

  • PATHOLOGY

TISSUE ATLAS KIDNEY

GENE/PROTEIN

Dictionary

Kidney

Tissue proteome

Kidney

KIDNEY - Expression summary

RNA expressioni

RNA expression shows average values based on RNA-seq data generated by HPA, the Genotype-Tissue Expression (GTEx) consortium or the FANTOM5 consortium.

Read more

HPA:4.0TPM
GTEx:1.7RPKM
FANTOM5:4.0Tags Per Million

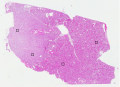
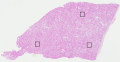
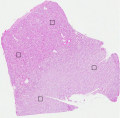
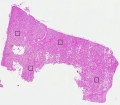
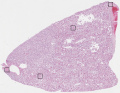
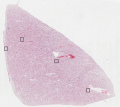
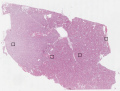
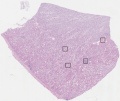
KIDNEY - Annotated protein expression

Pending normal tissue analysis


KIDNEY - HPA RNA-seqi

The RNA-seq details section shows detailed information about the individual samples used for the transcript profiling and results of the RNA-seq analysis.

Information about each individual sample is listed below, including gender, age, a tissue section image and estimated fractions of cell types. TPM (transcripts per million) values give a quantification of the gene abundance which is comparable between different genes and samples.

Read more

Average TPM

4.0

overview Female, age 58 Sample 1
TPM: 2.7
Cell types%
Cells in tubules: 60
Cells in glomeruli: 20
Fibroblasts: 5
Other cell types: 15
overview Female, age 67 Sample 2
TPM: 3.6
Cell types%
Cells in tubules: 70
Cells in glomeruli: 15
Fibroblasts: 10
Other cell types: 5
overview Female, age 55 Sample 3
TPM: 3.3
Cell types%
Cells in tubules: 80
Cells in glomeruli: 10
Fibroblasts: 5
Other cell types: 5
overview Male, age 46 Sample 4
TPM: 4.1
Cell types%
Cells in tubules: 60
Cells in glomeruli: 25
Fibroblasts: 5
Other cell types: 10
overview Female, age 57 Sample 5
TPM: 3.8
Cell types%
Cells in tubules: 60
Cells in glomeruli: 10
Fibroblasts: 10
Other cell types: 20
overview Male, age 78 Sample 6
TPM: 7.5
Cell types%
Cells in tubules: 65
Cells in glomeruli: 10
Fibroblasts: 5
Other cell types: 20
overview Male, age 73 Sample 7
TPM: 0.2
Cell types%
Cells in tubules: 60
Cells in glomeruli: 10
Fibroblasts: 10
Other cell types: 20
overview Female, age 59 Sample 8
TPM: 4.9
Cell types%
Cells in tubules: 65
Cells in glomeruli: 10
Fibroblasts: 10
Other cell types: 15
overview Female, age 48 Sample 9
TPM: 5.9
Cell types%
Cells in tubules: 60
Cells in glomeruli: 5
Fibroblasts: 10
Other cell types: 25

KIDNEY - GTEx RNA-seqi

RNA-Seq data is reported as average RPKM (reads per kilobase per million mapped reads), generated by the Genotype-Tissue Expression (GTEx) project. More information can be found on the GTEx portal.

Normal distribution across the dataset is visualized with box plots, shown as median and 25th and 75th percentiles. Points are displayed as outliers if they are above or below 1.5 times the interquartile range. RPKM values of the individual samples are presented next to the box plot.

Read more

Average RPKM

1.7

GTEx sample id

Sample description

RPKM

Kidney - Cortex
RPKM: 1.7
Samples: 32

Max RPKM: 9.6
Min RPKM: 0.1
Std RPKM: 1.7
Median RPKM: 1.0
GTEX-13OVI-1126-SM-5KLZF 60-69 years, female 9.6
GTEX-13RTJ-2226-SM-5S2Q1 60-69 years, male 4.0
GTEX-ZLFU-0926-SM-5P9F8 40-49 years, male 3.9
GTEX-1399S-0526-SM-5IJG8 30-39 years, female 3.5
GTEX-147F4-2626-SM-5Q5CS 50-59 years, male 3.4
GTEX-13112-2126-SM-5GCO4 50-59 years, male 2.6
GTEX-11TTK-1926-SM-5PNW8 60-69 years, female 2.4
GTEX-13OVL-1826-SM-5KLZR 50-59 years, male 2.3
GTEX-NPJ8-2226-SM-3TW8D 40-49 years, male 2.3
GTEX-QLQW-1626-SM-4R1K1 30-39 years, male 2.3
GTEX-ZVZP-0926-SM-5GIDB 50-59 years, male 2.1
GTEX-RN64-1626-SM-48FD7 50-59 years, male 2.0
GTEX-11GS4-2326-SM-5A5KS 60-69 years, male 1.8
GTEX-13NYB-1726-SM-5N9G2 40-49 years, male 1.1
GTEX-ZYT6-2226-SM-5GIC9 30-39 years, male 1.1
GTEX-12WSG-0826-SM-5EQ5A 50-59 years, female 1.0
GTEX-XPVG-0526-SM-4B65N 50-59 years, male 1.0
GTEX-11OF3-1326-SM-5N9FJ 60-69 years, male 0.9
GTEX-N7MS-1626-SM-3LK5F 60-69 years, male 0.9
GTEX-QDVN-1626-SM-48TZC 50-59 years, male 0.8
GTEX-ZYFG-1626-SM-5GZYY 60-69 years, female 0.8
GTEX-12696-0926-SM-5FQTV 60-69 years, male 0.7
GTEX-P4QS-1126-SM-3NMD5 60-69 years, male 0.7
GTEX-UPIC-1126-SM-4IHLO 20-29 years, female 0.7
GTEX-ZC5H-1726-SM-5HL7X 40-49 years, female 0.7
GTEX-13OW6-1826-SM-5N9F9 50-59 years, male 0.6
GTEX-145MN-0326-SM-5QGQI 30-39 years, male 0.6
GTEX-Y5V6-2026-SM-5IFHO 60-69 years, male 0.5
GTEX-1497J-0826-SM-5NQAJ 60-69 years, male 0.4
GTEX-13O1R-2526-SM-5N9FW 60-69 years, male 0.1
GTEX-T5JC-1526-SM-4DM68 20-29 years, male 0.1
GTEX-ZYFD-1526-SM-5NQ7T 50-59 years, male 0.1
Show all

KIDNEY - FANTOM5 CAGEi

Tissue data obtained through Cap Analysis of Gene Expression (CAGE) are reported as Tags Per Million, generated by the FANTOM5 project. More information can be found here.

Read more

Average Tags Per Million

4.0

FANTOM5 sample id

Sample description

Tags Per Million

Kidney
Tags Per Million: 4.0
FF:10017-101C8 60,62,63 years, female 4.0

Contact

  • BLOG
  • PRESS ROOM
  • contact@proteinatlas.org

The Project

  • INTRODUCTION
  • ORGANIZATION
  • PUBLICATIONS
  • DOWNLOADABLE DATA

The Human Protein Atlas

  • ANTIBODY AVAILABILITY
  • LICENCE & CITATION
  • HELP & FAQ
The Human Protein Atlas project is funded
by the Knut & Alice Wallenberg foundation.