We use cookies to enhance the usability of our website. If you continue, we'll assume that you are happy to receive all cookies. More information. Don't show this again.
Fields »
 

Field

Term
Gene name

Class

Subclass

Chromosome

External id

In atlas

Reliability

Reliability

Reliability

Validation

Method

Validation

Method

Validation

Method

Validation

Location

Searches

Tissue

Cell type

Expression

Tissue

Specificity

Cell line

Specificity

Cancer

Specificity

Tissue

Detectable

Cell line

Detectable

Cancer

Detectable

Cancer

Prognosis

Category

Score

Score

Score

Antibodies

Column


ABOUT
HELP
BLOG
  • THE HUMAN PROTEOME
  • THE HUMAN TISSUES
  • THE HUMAN CELL
  • HUMAN PATHOLOGY
  • PROTEIN CLASSES
  • PROTEIN EVIDENCE
    • NEWS
    • BLOG
    • EVENTS
    • PRESS ROOM
    • LEARN
    • DICTIONARY
    • METHODS
    • CELL LINES
  • THE PROJECT
  • INTRODUCTION
  • ORGANIZATION
  • PUBLICATIONS
  • PUBLICATION DATA
  • ANTIBODY SUBMISSION
  • ANTIBODY AVAILABILITY
  • LINKS
  • CONTACT
  • TECHNICAL DATA
  • ANTIBODY VALIDATION
  • ASSAYS & ANNOTATION
  • DISCLAIMER
  • DOWNLOADABLE DATA
  • HELP & FAQ
  • LICENCE & CITATION
  • PRIVACY STATEMENT
  • RELEASE HISTORY
ABAT
  • premium

    TISSUE

  • premium

    CELL

  • PATHOLOGY

TISSUE ATLAS PRIMARY DATA HIPPOCAMPUS

GENE/PROTEIN

Antibody validation


Dictionary

Hippocampus

HIPPOCAMPUS - Expression summary

Protein expressioni

The protein expression bar, with the units not detected (n), low (l), medium (m) and high (h), is based on a best estimate of the true protein expression for proteins where the antibody staining pattern has been analyzed by knowledge-based annotation. For genes where more than one antibody has been used, a collective score is set. For details, see Assays & annotation.

h
m
l
n

RNA expressioni

RNA expression shows average values based on RNA-seq data generated by HPA, the Genotype-Tissue Expression (GTEx) consortium or the FANTOM5 consortium.

Read more

GTEx:8.0RPKM
FANTOM5:186.0Tags Per Million

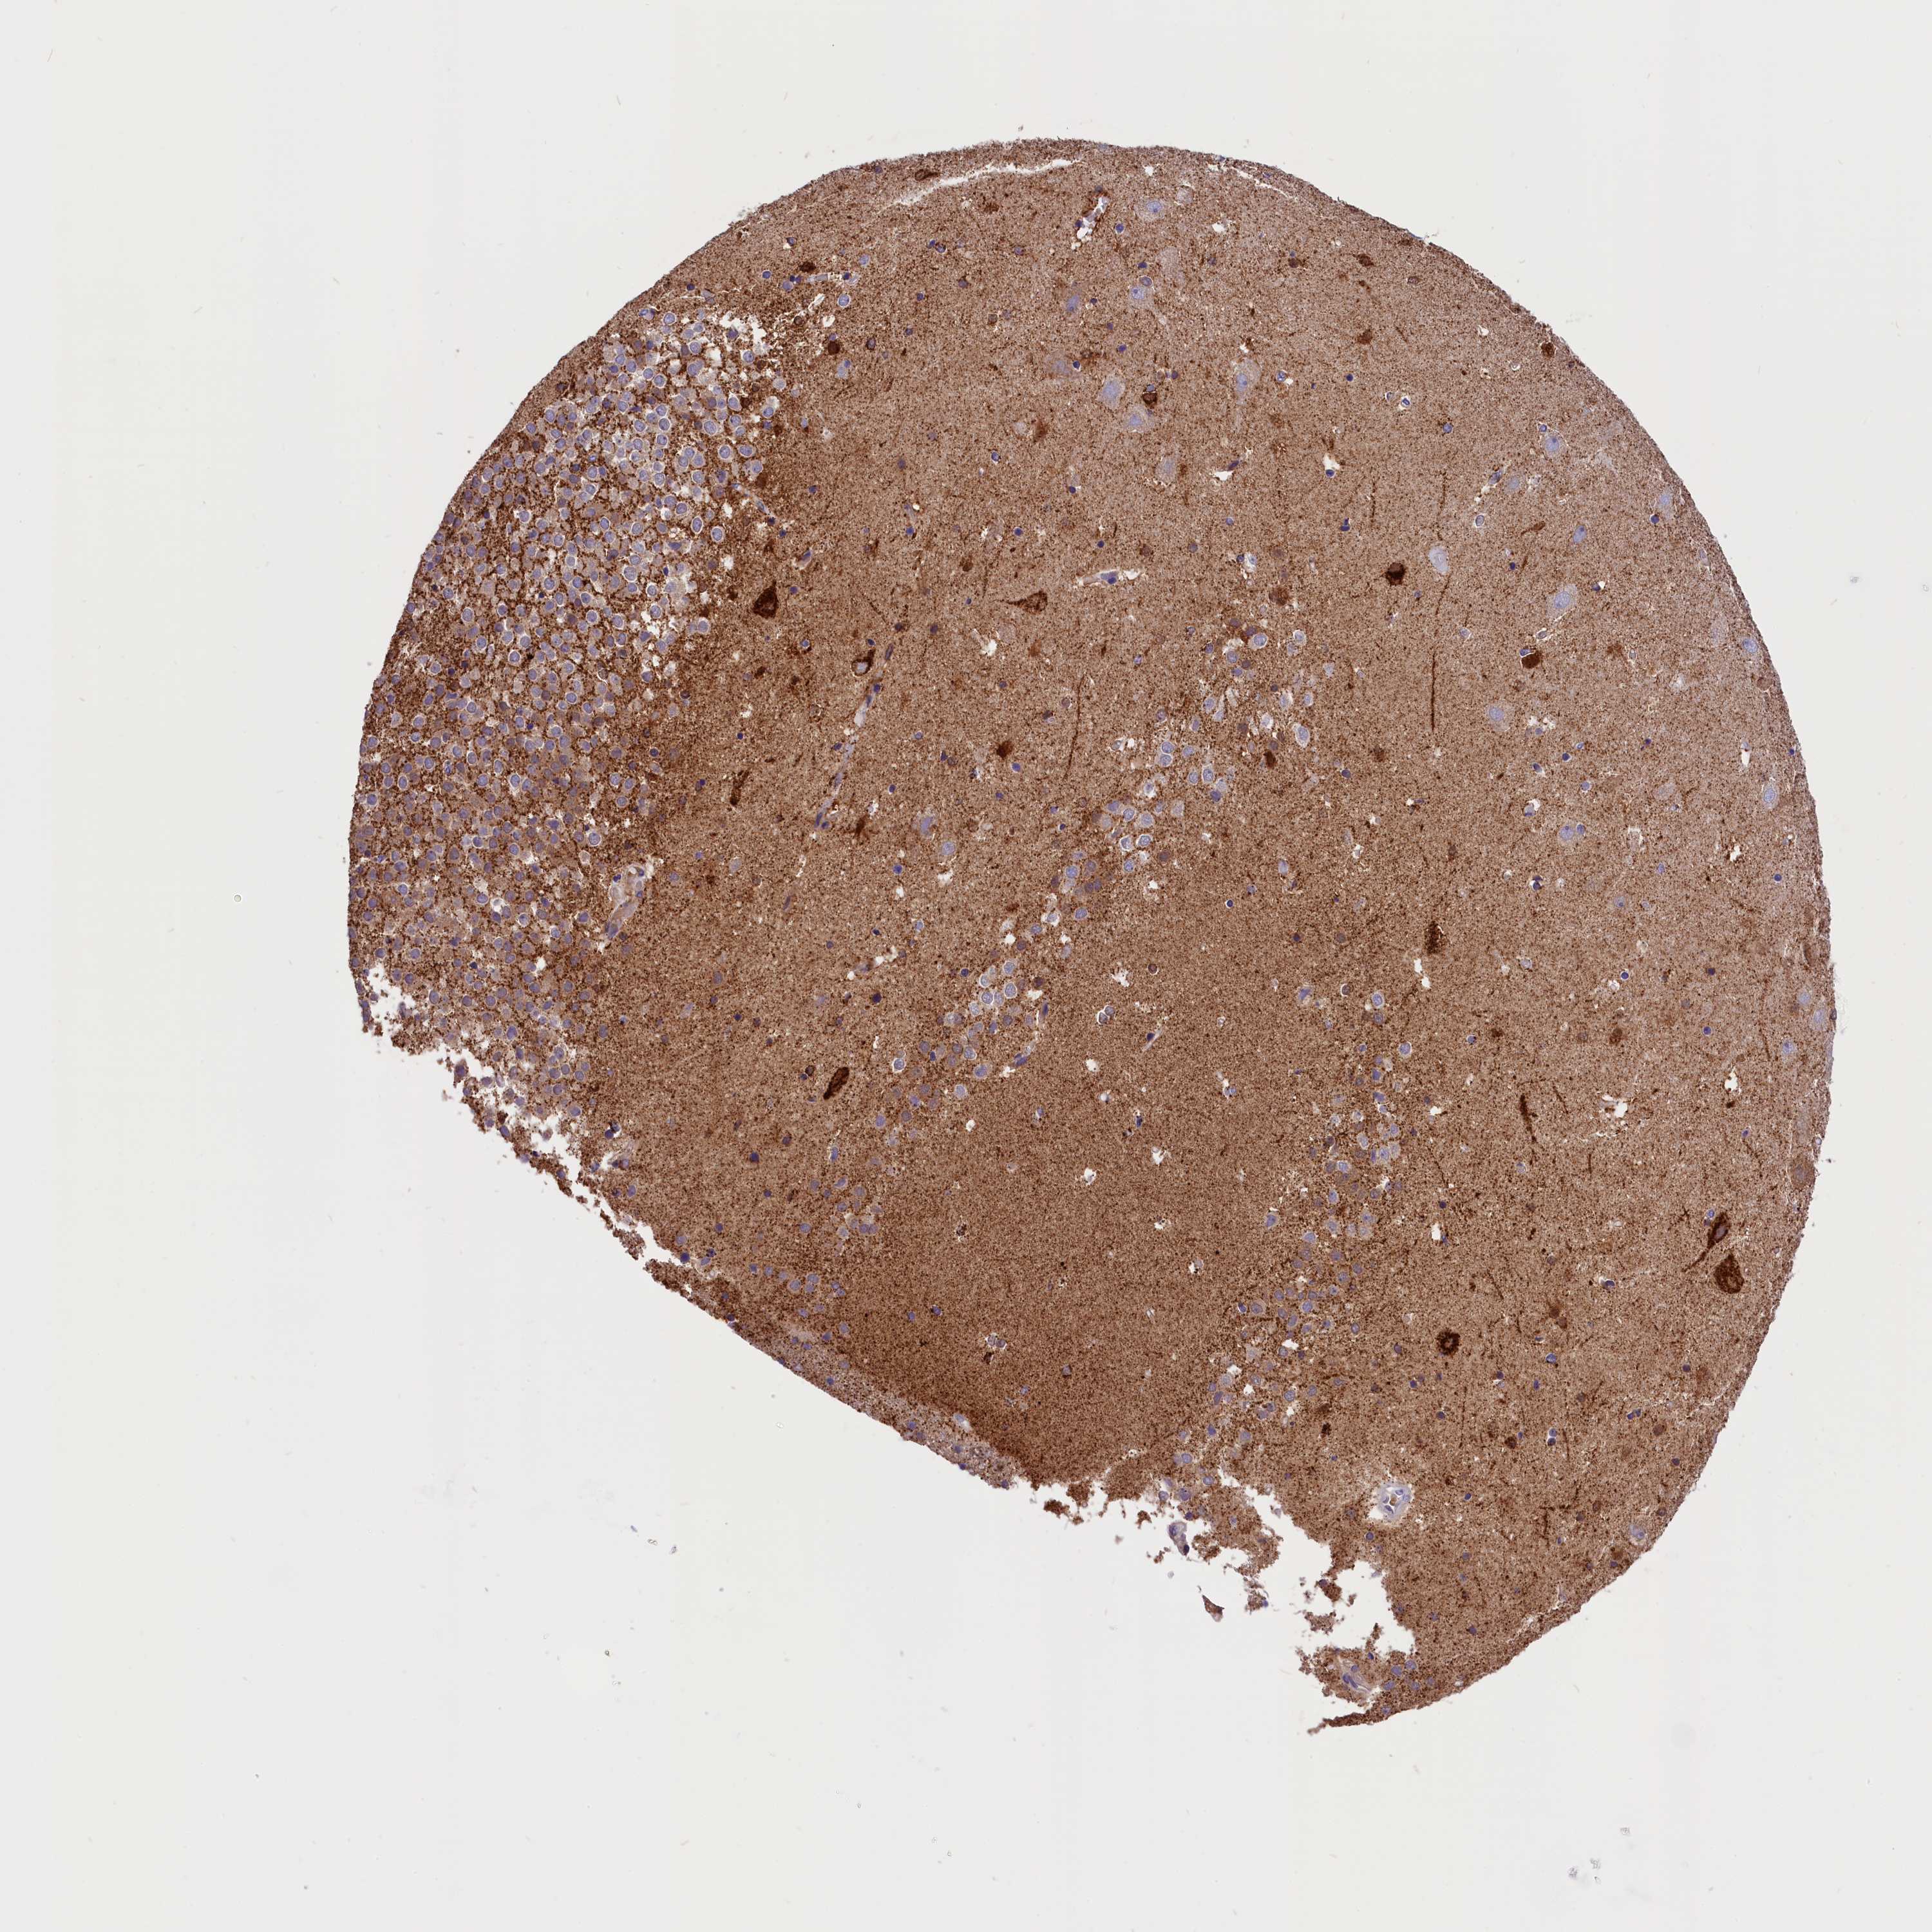
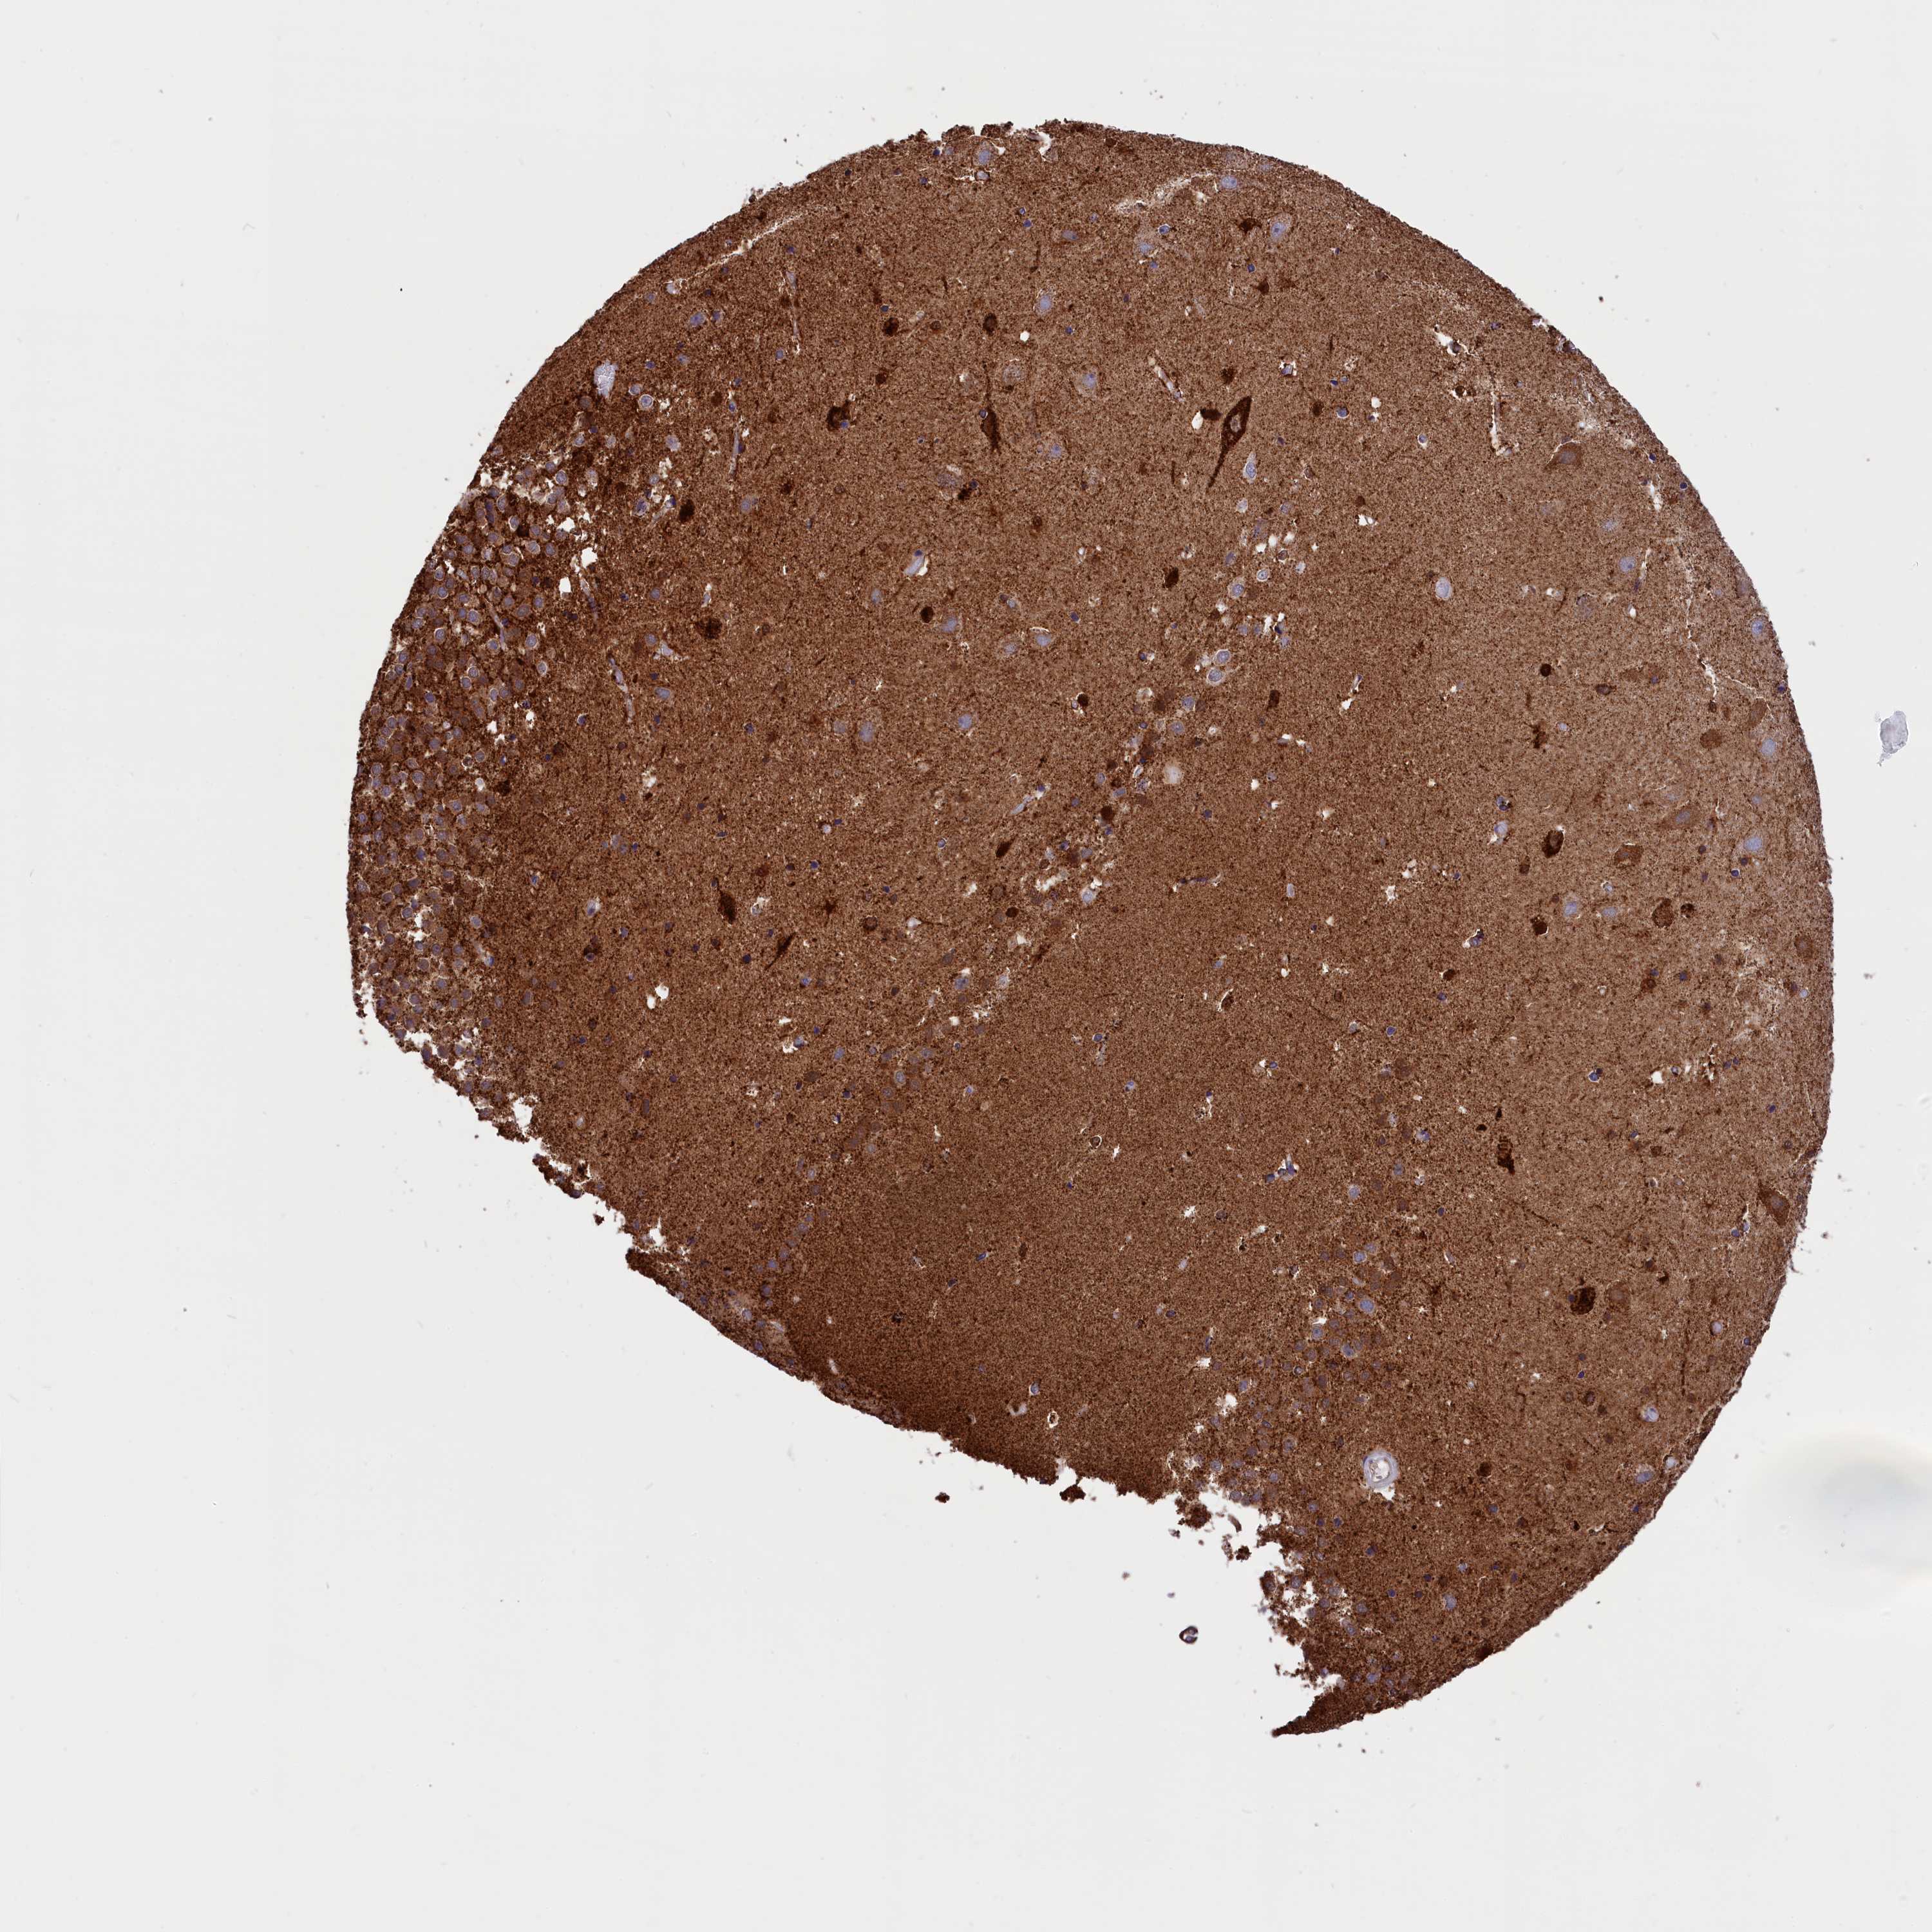
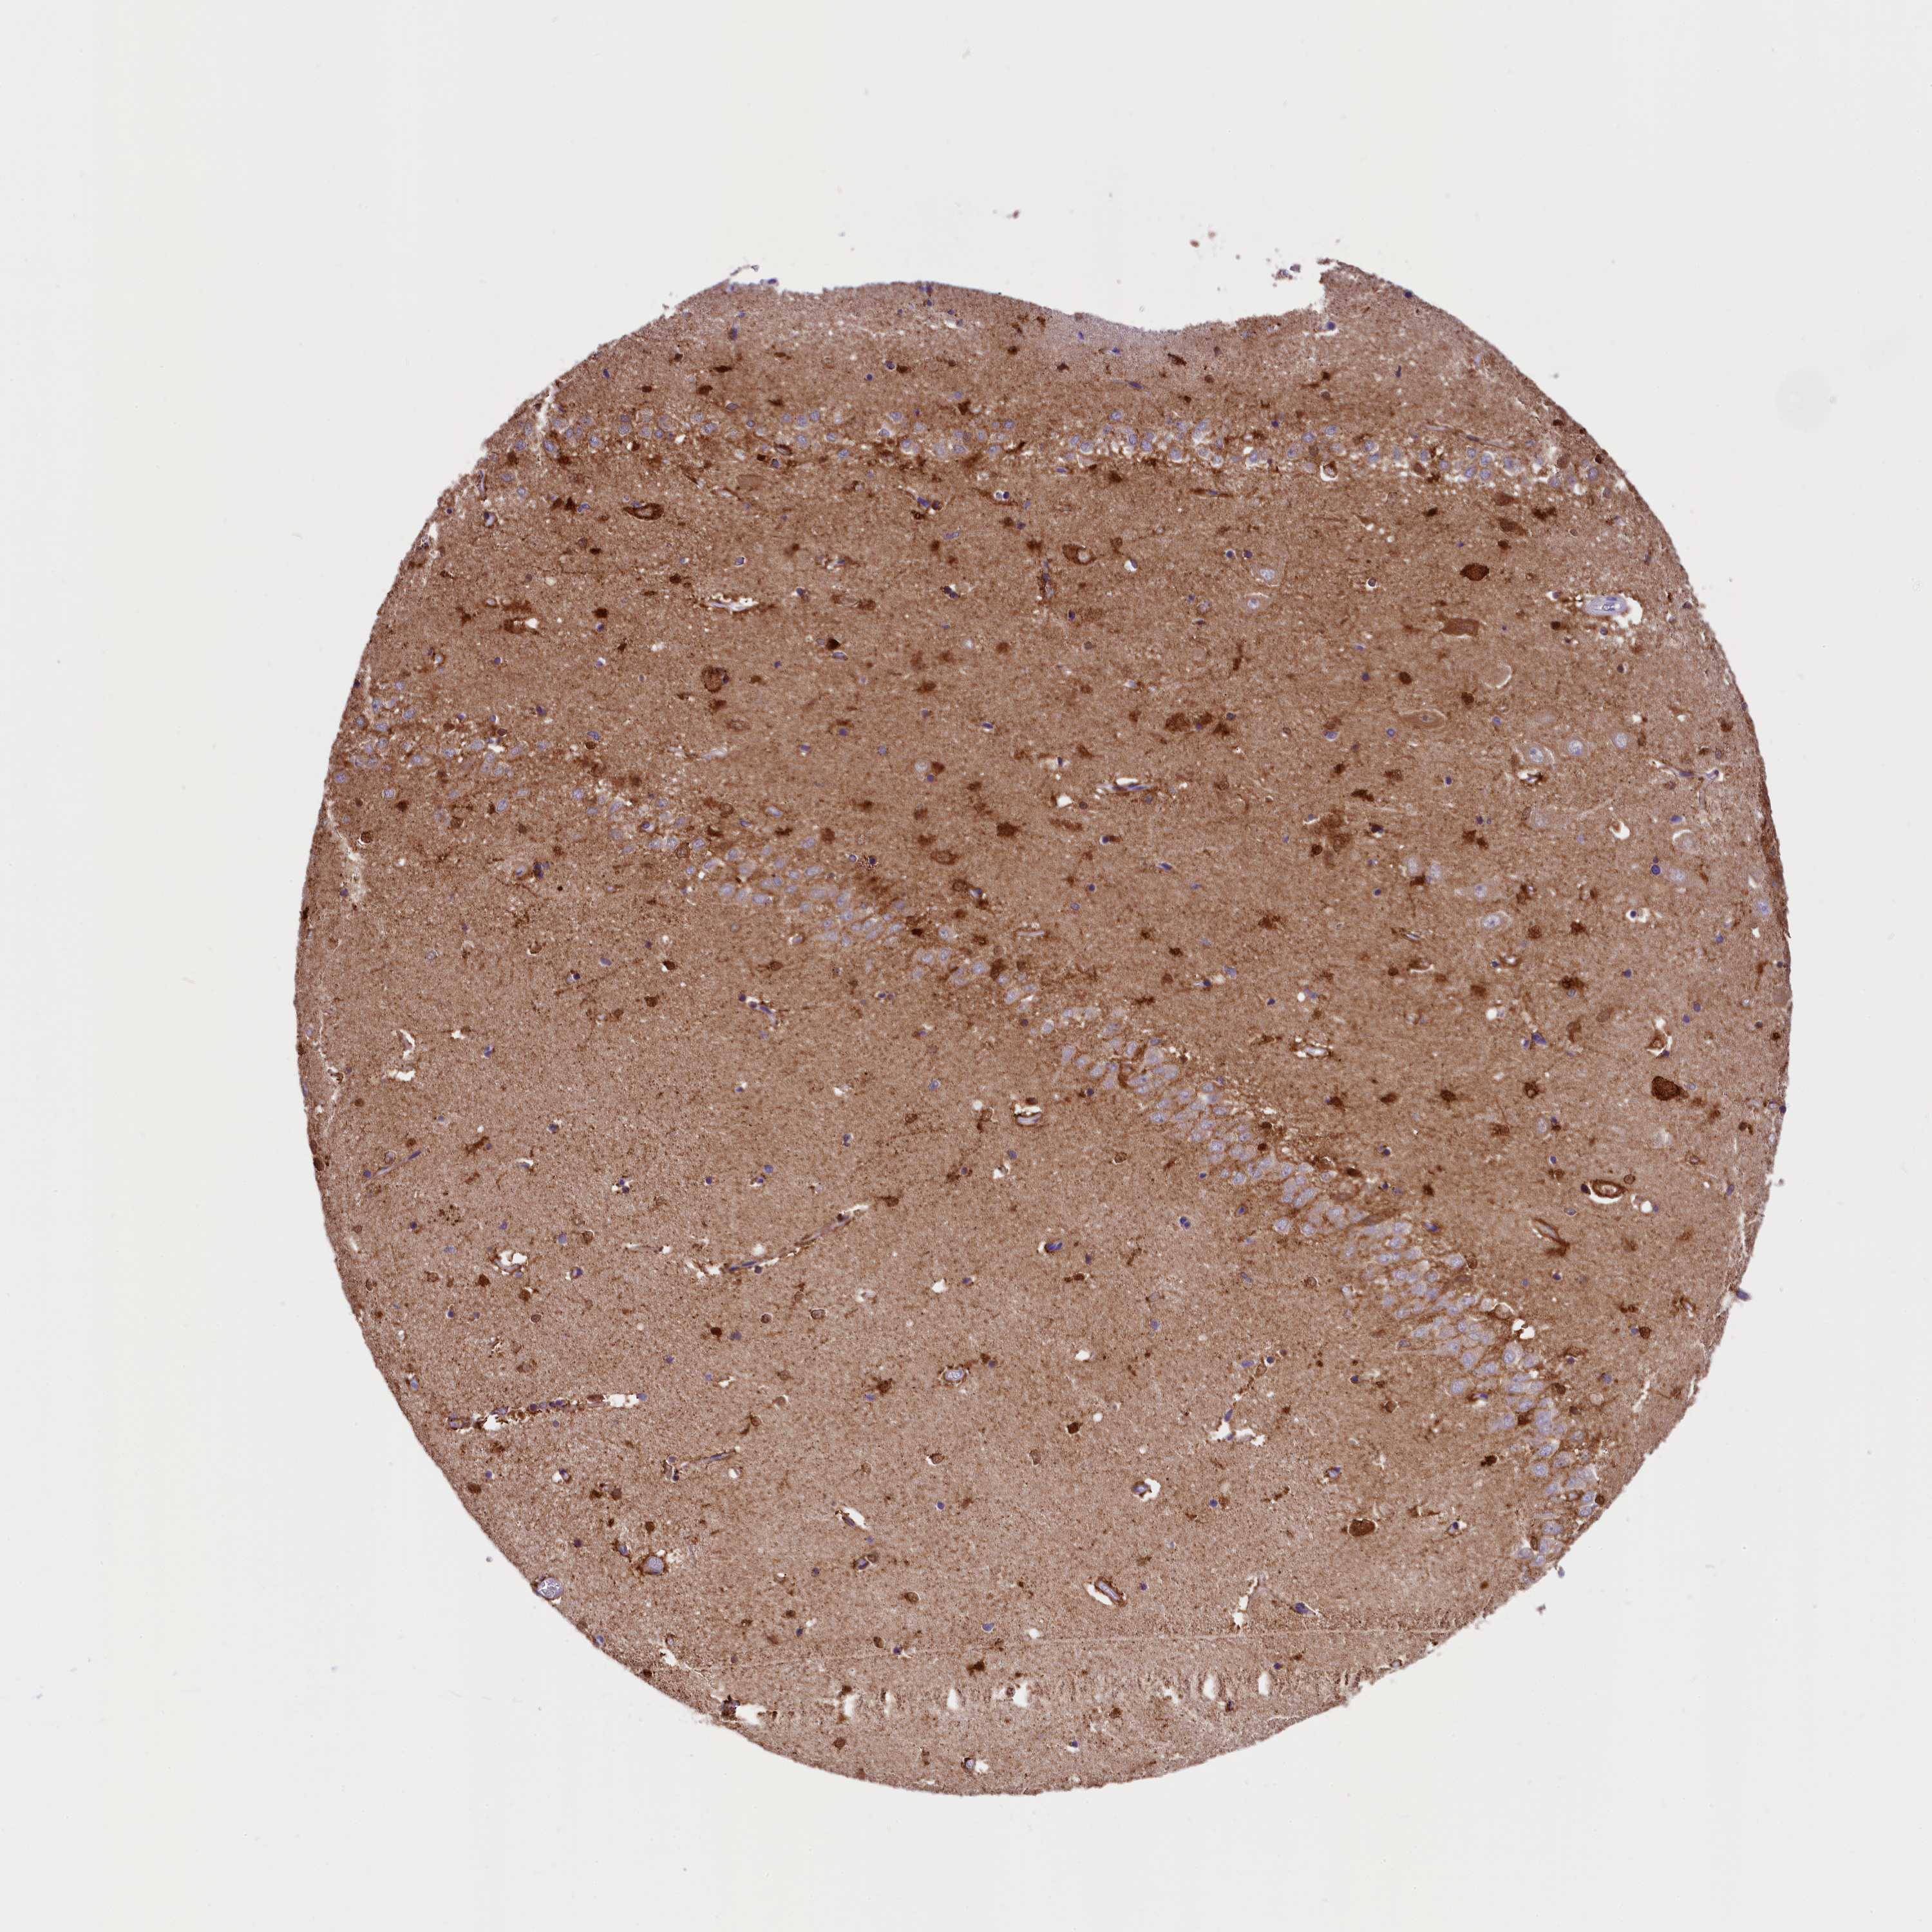
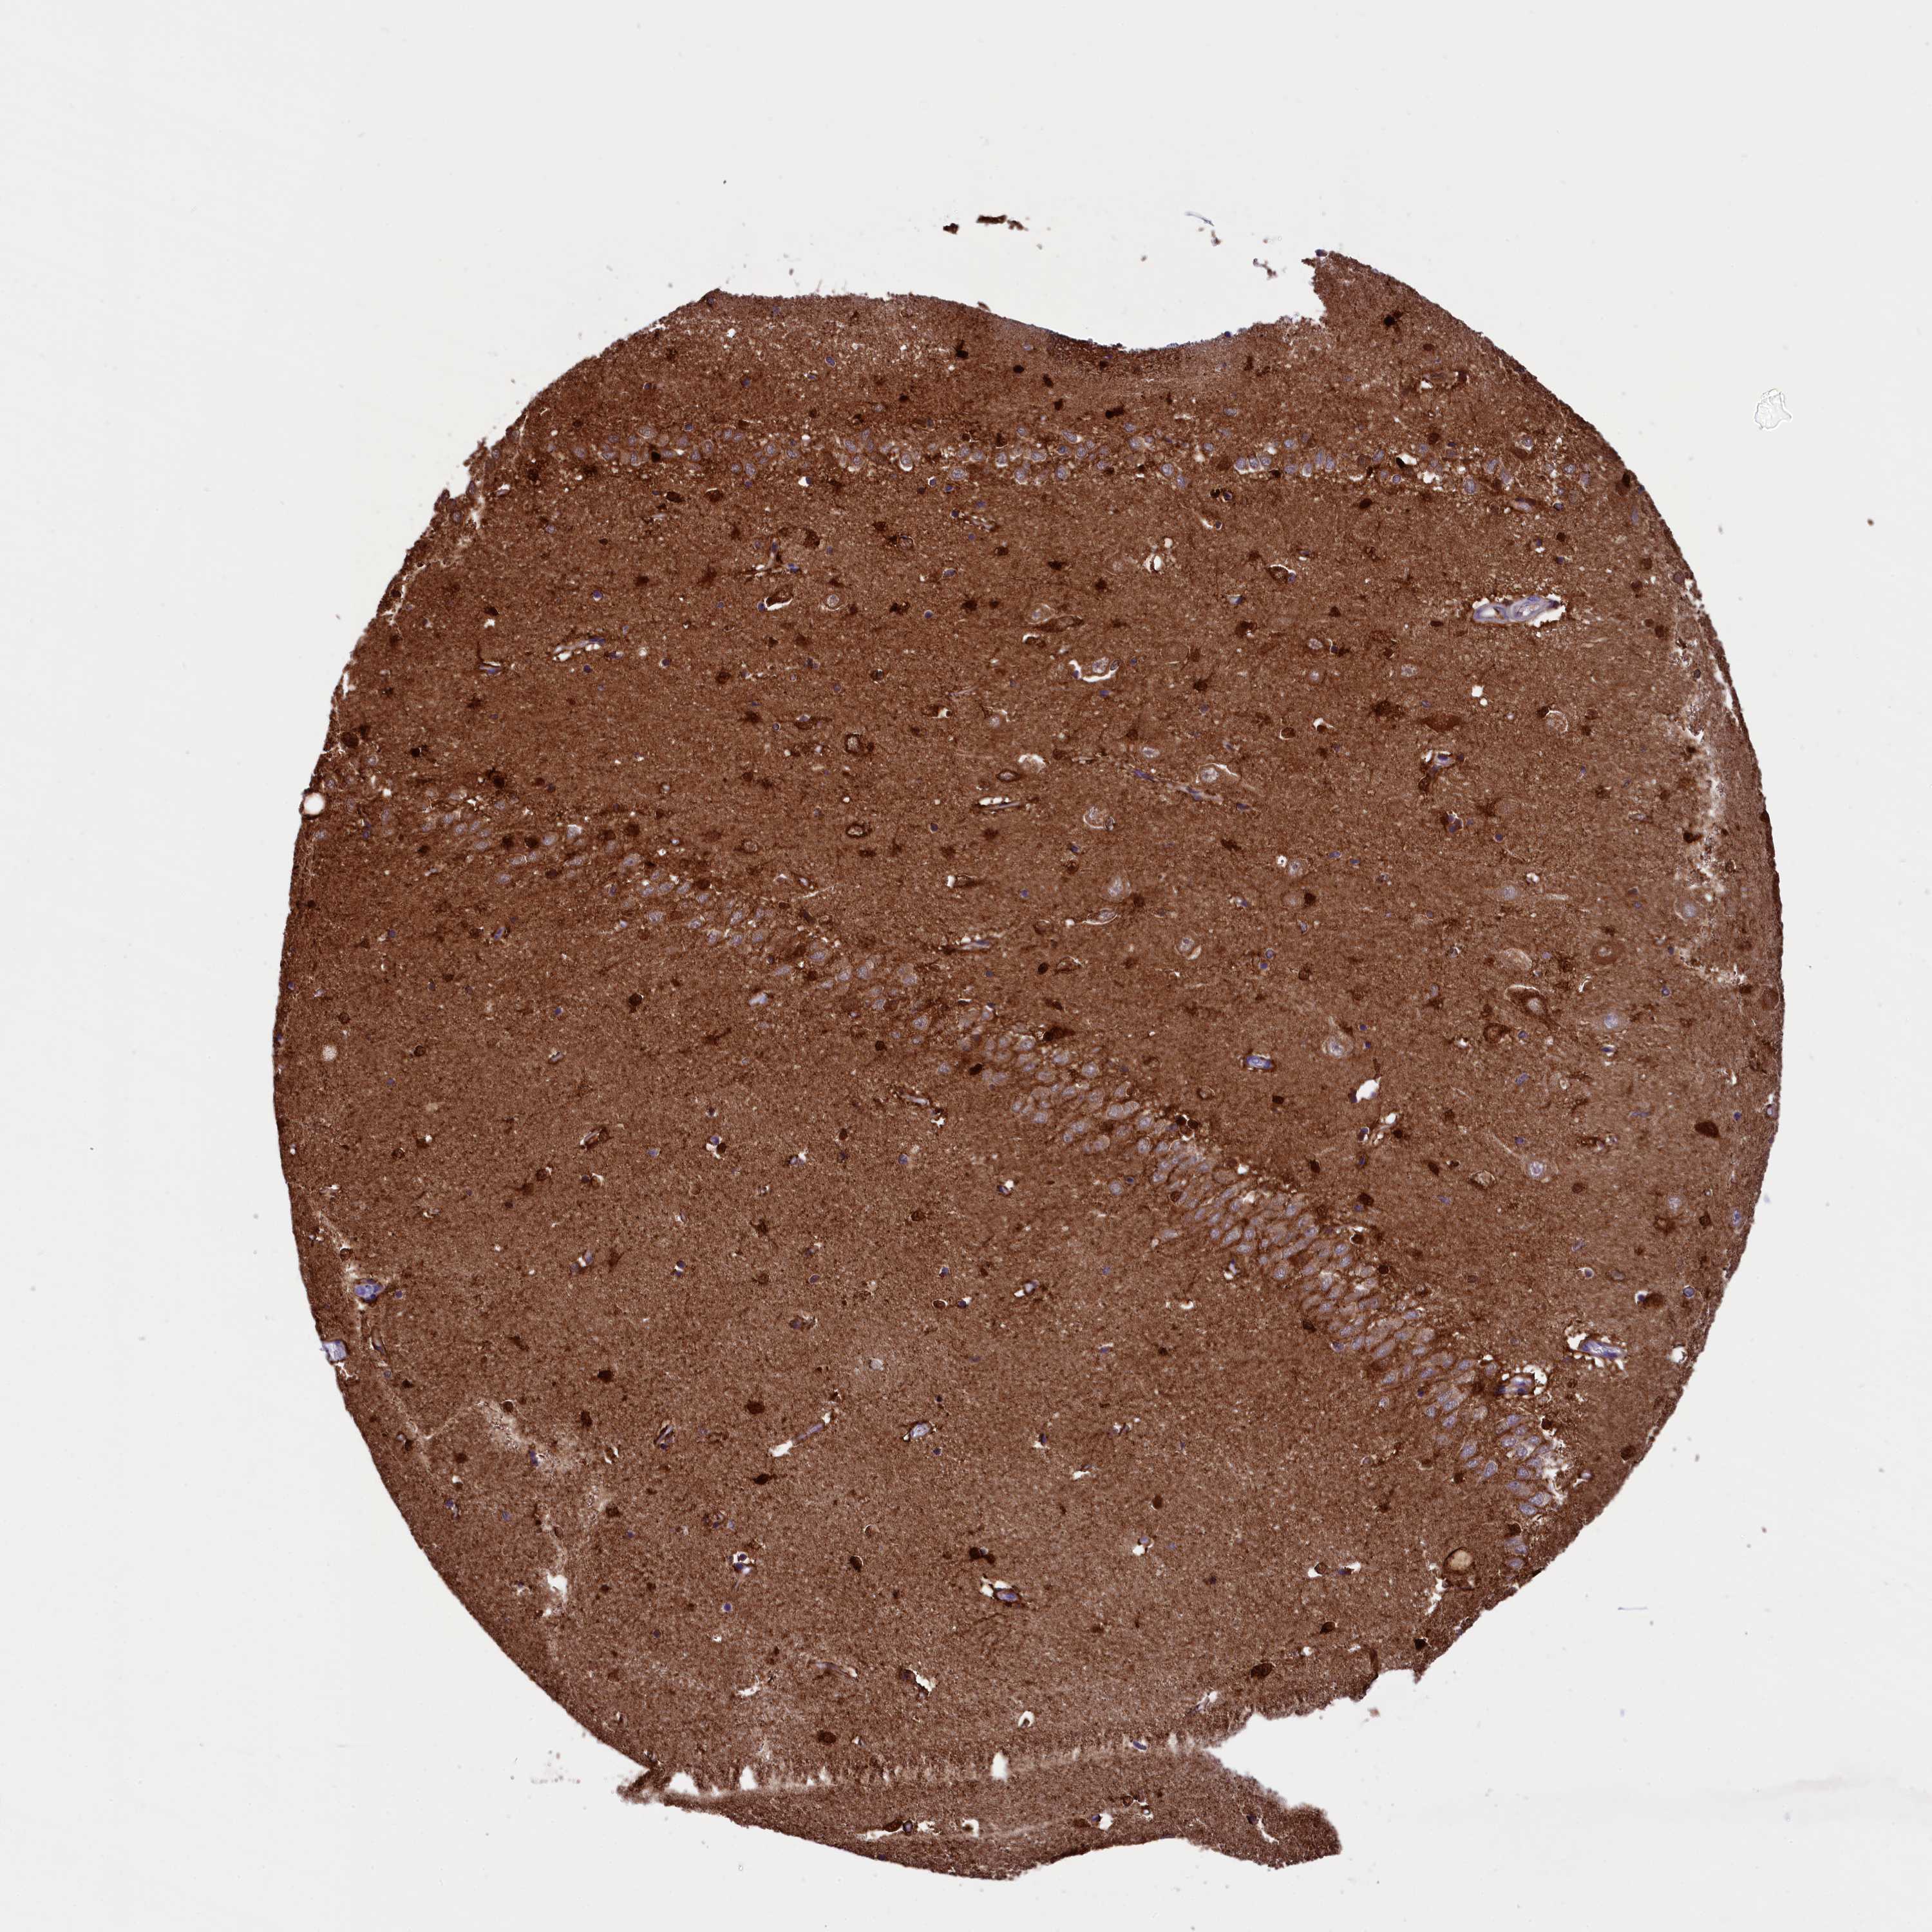
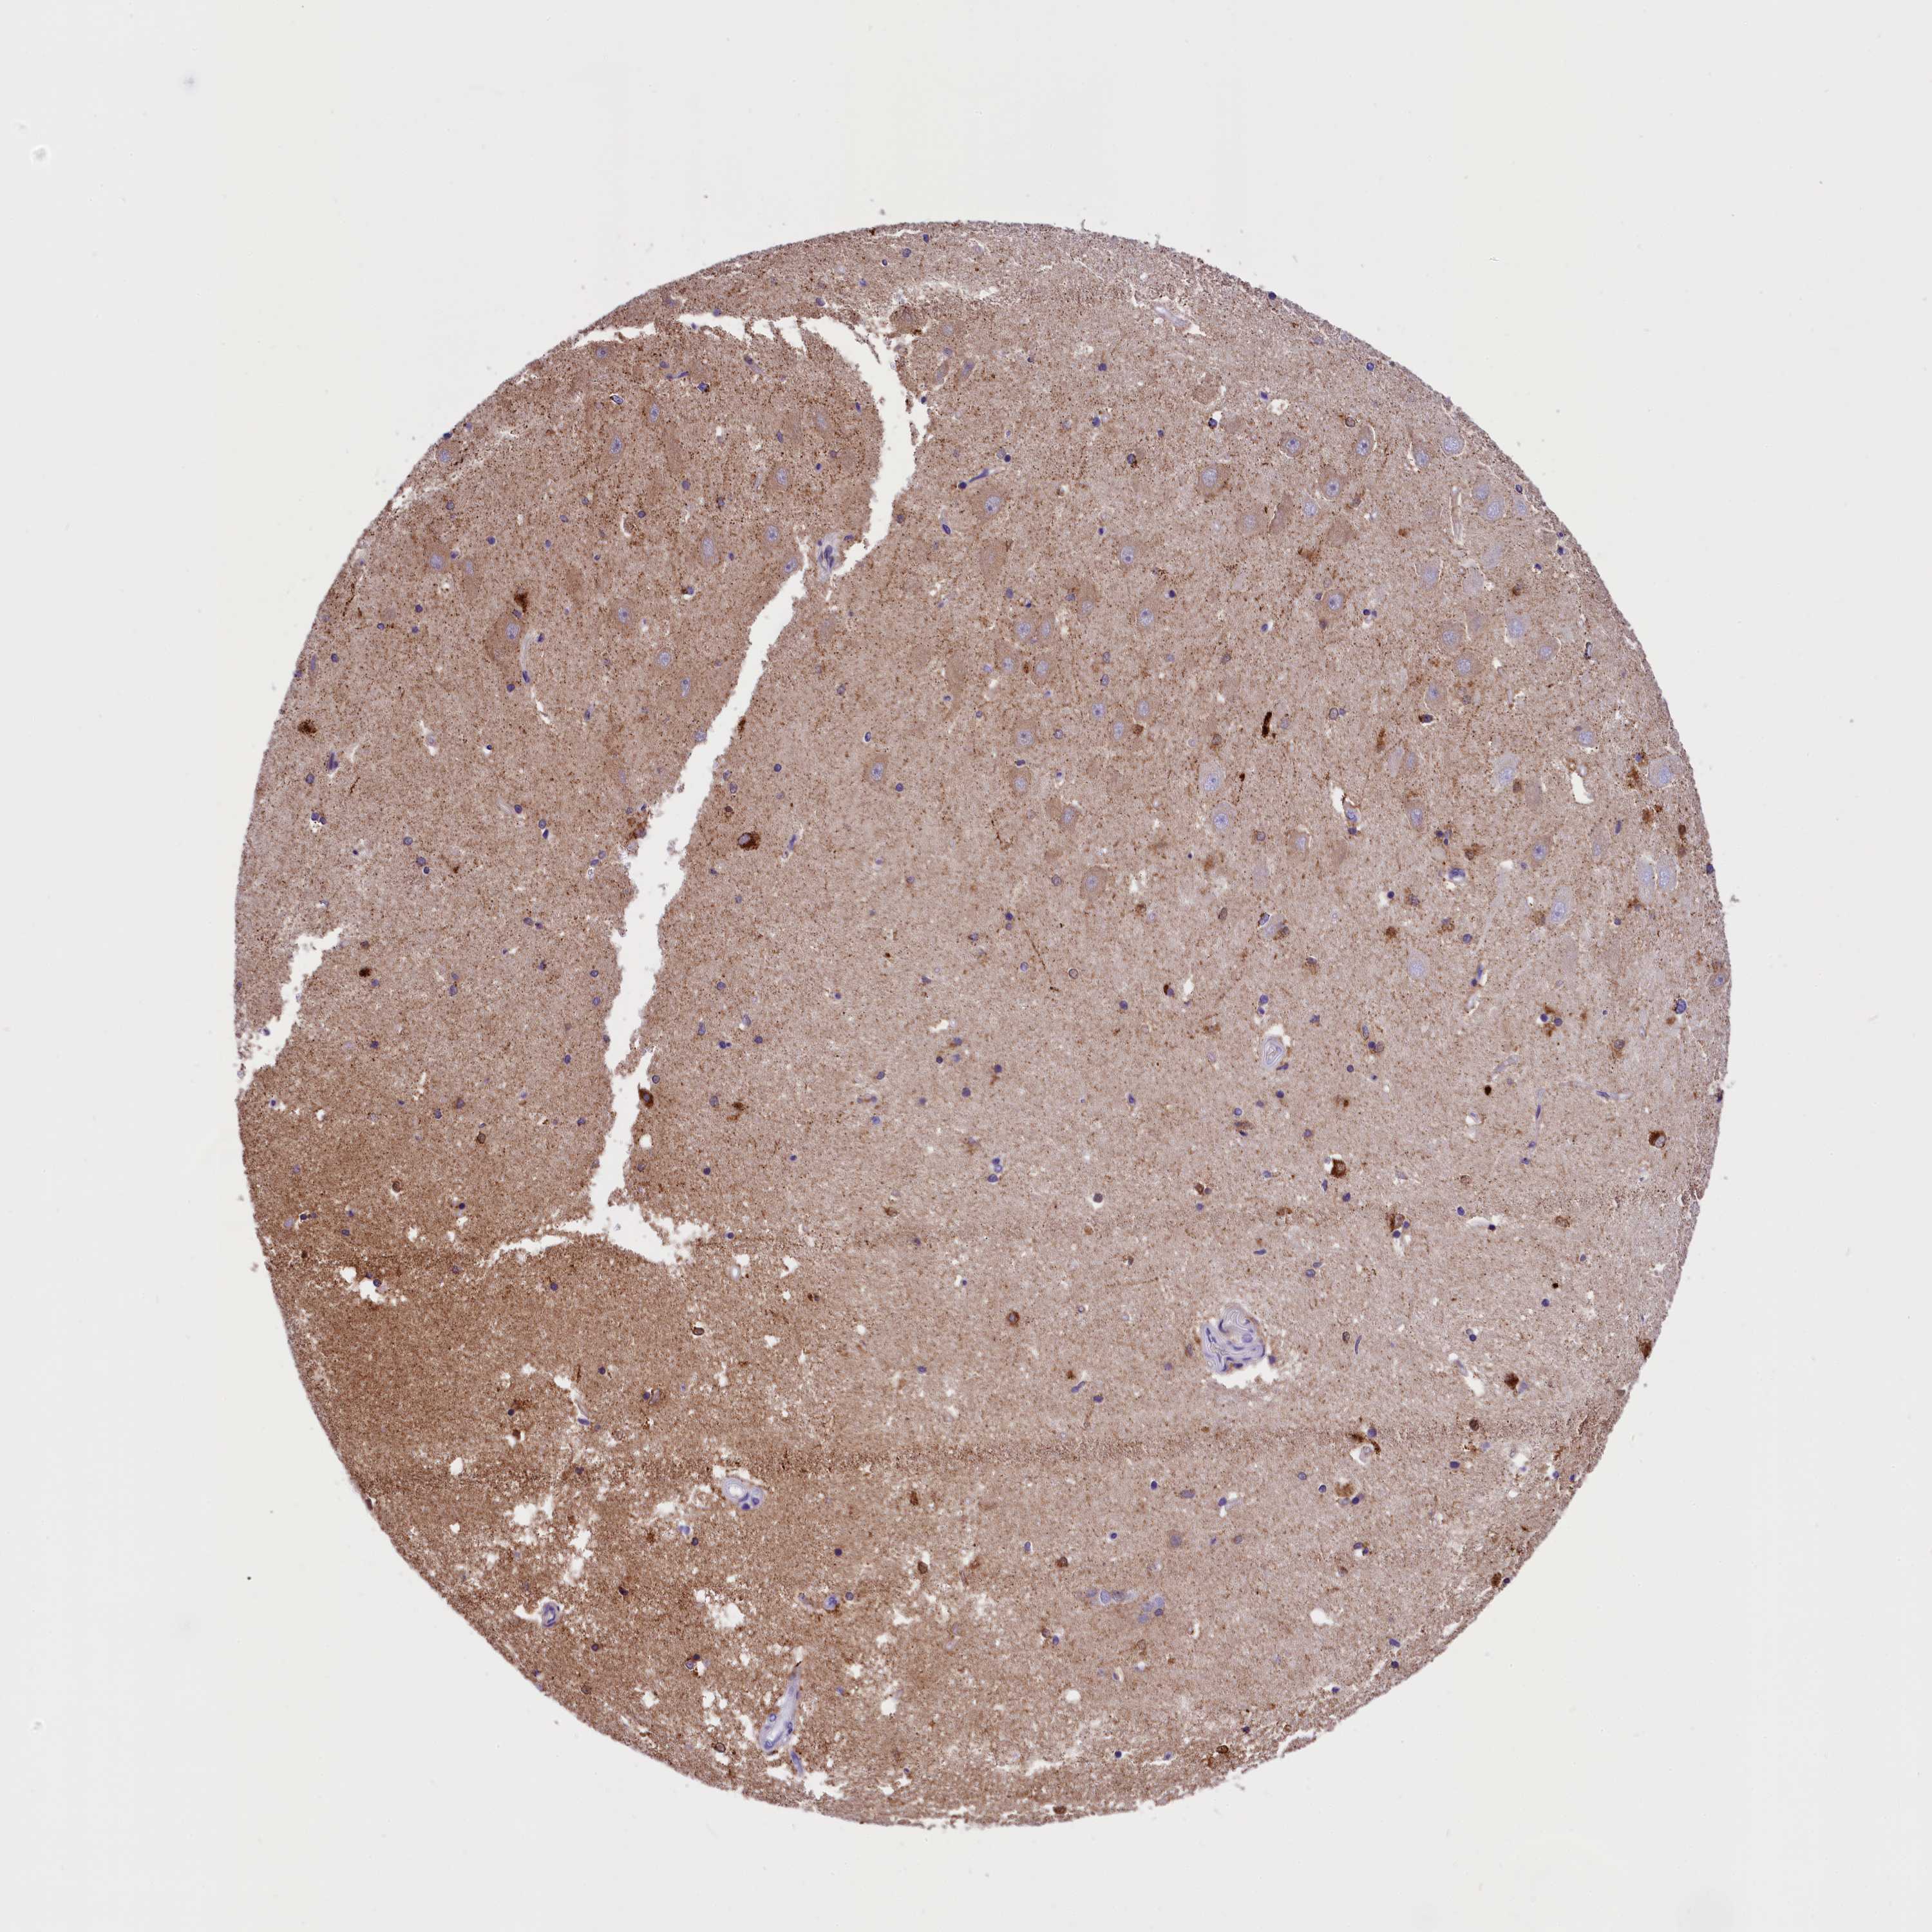
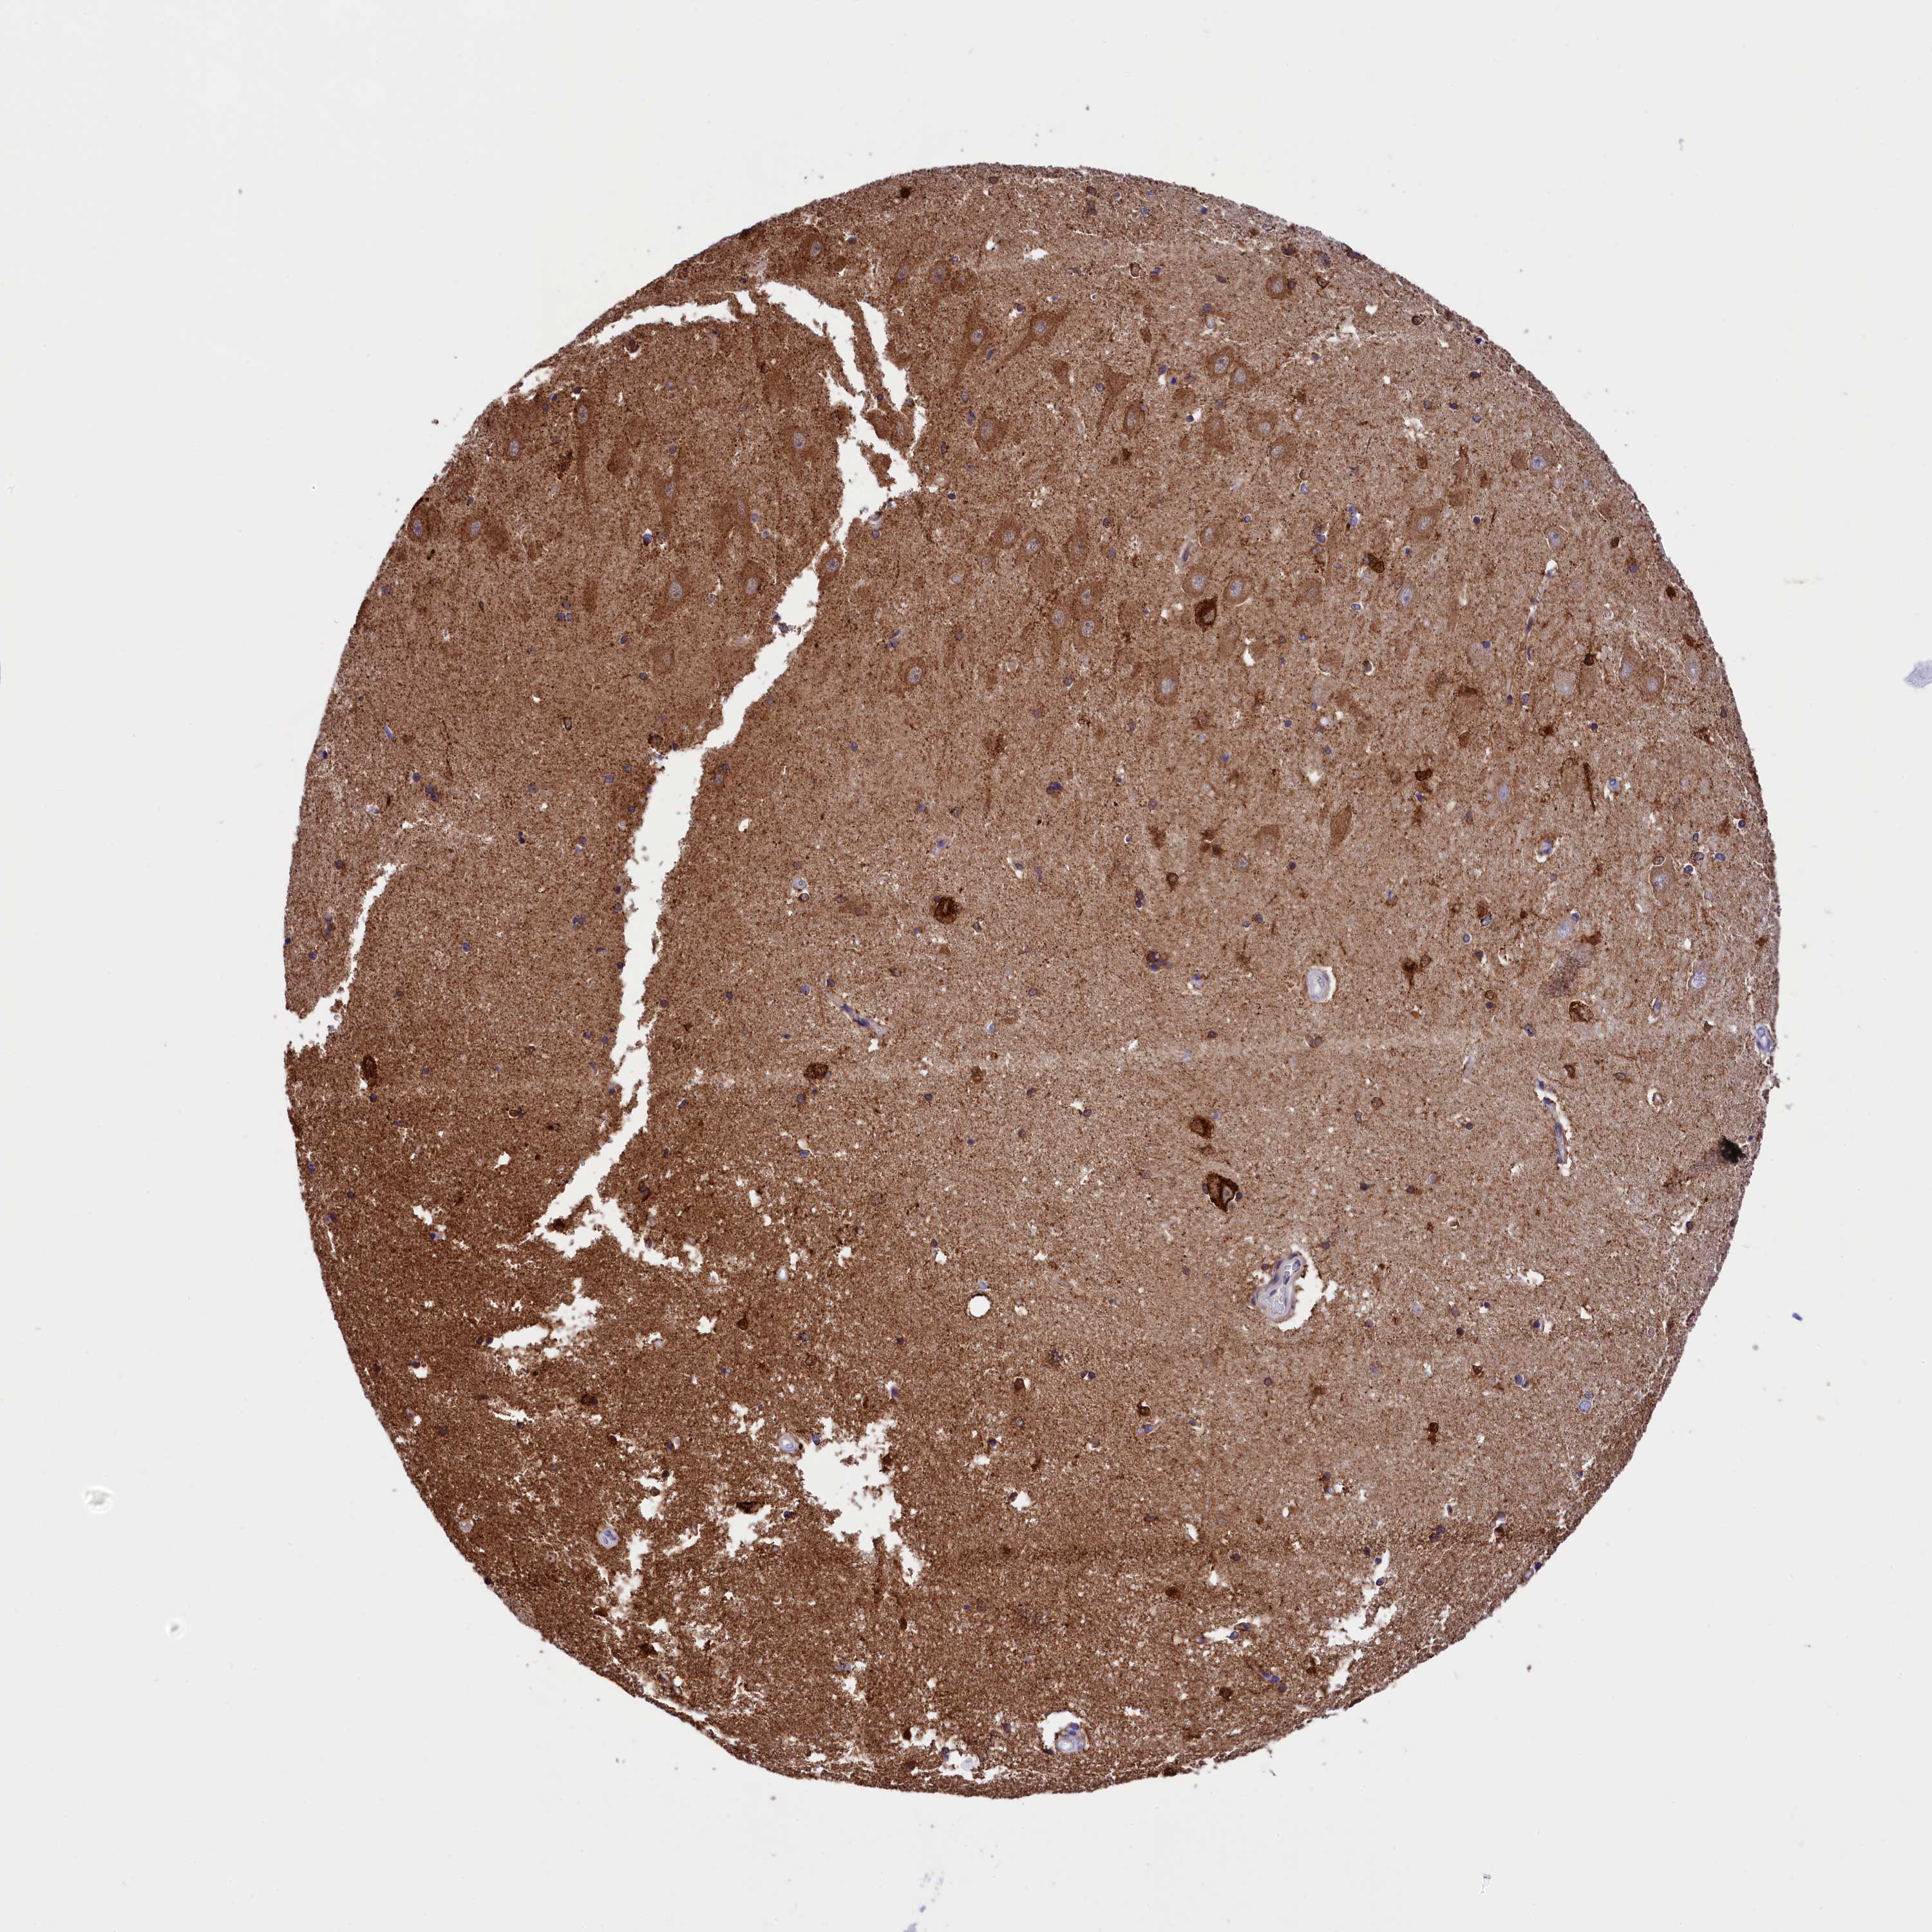
HIPPOCAMPUS - Annotated protein expressioni

The detailed normal tissue page shows images of the stained tissue, together with antibody staining and expression level of the cell types. A knowledge-based annotated protein expression is provided for each cell type at the top of the page and the staining level of the individual antibodies is given underneath each antibody ID.

Samples from up to three different individuals have been stained for each antibody. The gender, age and tissue characterization are reported for each individual (patient) and are viewable when clicking on the image for magnification.

The images can be clicked for an enlarged view that can be panned. From the enlarged view, all stained images for all antibodies can be browsed (represented by miniature images). The miniature image with an orange overlay is the currently displayed image.

For histological reference, view the histological dictionary.

Annotated protein
expression

Glial cells:High
Neuronal cells:Medium
 

Antibody stainingi

This score describes the level of antibody staining observed in the annotated cell types as not detected, low, medium, or high. It is based on the staining intensity and fraction of stained cells.

Read more

Antibody HPA041528


Antibody HPA041690


Glial cells

Medium   High  

Neuronal cells

Medium   Medium  


HIPPOCAMPUS - HPA RNA-seqi

The RNA-seq details section shows detailed information about the individual samples used for the transcript profiling and results of the RNA-seq analysis.

Information about each individual sample is listed below, including gender, age, a tissue section image and estimated fractions of cell types. TPM (transcripts per million) values give a quantification of the gene abundance which is comparable between different genes and samples.

Read more

Pending HPA RNA-seq analysis


HIPPOCAMPUS - GTEx RNA-seqi

RNA-Seq data is reported as average RPKM (reads per kilobase per million mapped reads), generated by the Genotype-Tissue Expression (GTEx) project. More information can be found on the GTEx portal.

Normal distribution across the dataset is visualized with box plots, shown as median and 25th and 75th percentiles. Points are displayed as outliers if they are above or below 1.5 times the interquartile range. RPKM values of the individual samples are presented next to the box plot.

Read more

Average RPKM

8.0

GTEx sample id

Sample description

RPKM

Brain - Hippocampus
RPKM: 8.0
Samples: 94

Max RPKM: 28.2
Min RPKM: 1.1
Std RPKM: 5.2
Median RPKM: 6.7
GTEX-R55E-0011-R1A-SM-2TC6N 20-29 years, male 28.2
GTEX-RNOR-0011-R1A-SM-5SI8F 50-59 years, female 24.7
GTEX-145MH-0011-R1b-SM-5PNWY 50-59 years, male 22.7
GTEX-QVJO-0011-R1A-SM-2S1QI 60-69 years, female 21.1
GTEX-13FLW-0011-R1b-SM-5LZX2 50-59 years, male 18.1
GTEX-QVUS-0011-R1A-SM-3GAD2 60-69 years, female 18.0
GTEX-WL46-0011-R1A-SM-3LK6M 50-59 years, male 17.5
GTEX-WWYW-0011-R1A-SM-3TW8G 50-59 years, female 16.6
GTEX-QDT8-0011-R1A-SM-32PKS 30-39 years, female 16.3
GTEX-12ZZX-0011-R1a-SM-5EQ6B 40-49 years, female 15.8
GTEX-13OW6-0011-R1a-SM-5L3HQ 50-59 years, male 14.1
GTEX-Q2AG-0011-R1A-SM-2HMJI 40-49 years, female 13.7
GTEX-ZAB4-0011-R1a-SM-4RGNO 40-49 years, male 13.6
GTEX-1313W-0011-R1b-SM-5EQ4A 50-59 years, female 12.7
GTEX-PWO3-0011-R1A-SM-2I5EW 60-69 years, female 12.6
GTEX-131XH-0011-R1a-SM-5DUWA 50-59 years, male 12.1
GTEX-P44H-0011-R1A-SM-3NM8J 40-49 years, male 12.1
GTEX-XOTO-0011-R1B-SM-4B65C 50-59 years, male 11.7
GTEX-13FHO-0011-R1b-SM-5KLZG 60-69 years, male 11.5
GTEX-131YS-0011-R1a-SM-5DUXC 60-69 years, female 11.4
GTEX-T5JC-0011-R1A-SM-32PM6 20-29 years, male 11.4
GTEX-X4XX-0011-R1B-SM-3P622 60-69 years, male 11.4
GTEX-13OVJ-0011-R1b-SM-5L3I6 50-59 years, female 10.9
GTEX-XMD1-0011-R1A-SM-4AT4C 60-69 years, male 10.7
GTEX-13N2G-0011-R1b-SM-5MR3G 60-69 years, male 9.8
GTEX-145LS-0011-R1b-SM-5PNUP 60-69 years, female 9.3
GTEX-WHSE-0011-R1A-SM-3P5ZK 20-29 years, male 9.2
GTEX-YFC4-0011-R1a-SM-4V6EH 40-49 years, female 9.2
GTEX-ZUA1-0011-R1a-SM-4YCE2 40-49 years, male 9.2
GTEX-13RTJ-0011-R1a-SM-5O9D9 60-69 years, male 9.1
GTEX-WZTO-0011-R1B-SM-3NMAR 40-49 years, male 9.1
GTEX-13JUV-0011-R1a-SM-5LZY4 40-49 years, female 8.9
GTEX-132Q8-0011-R1a-SM-5EGLK 60-69 years, male 8.8
GTEX-X585-0011-R1B-SM-46MVE 50-59 years, male 8.8
GTEX-13G51-0011-R1a-SM-5LZYR 60-69 years, male 8.3
GTEX-11GSO-0011-R1b-SM-57WD3 60-69 years, male 8.1
GTEX-PVOW-0011-R1A-SM-32PL6 40-49 years, male 7.9
GTEX-14ASI-0011-R1b-SM-5S2TY 60-69 years, male 7.7
GTEX-TSE9-0011-R1A-SM-3DB7E 60-69 years, female 7.5
GTEX-13NYB-0011-R1b-SM-5KM4F 40-49 years, male 7.3
GTEX-13O3Q-0011-R1b-SM-5KM3L 50-59 years, male 7.3
GTEX-WVLH-0011-R1A-SM-4MVOK 50-59 years, male 7.3
GTEX-13X6I-0011-R1b-SM-5PNZC 60-69 years, male 7.2
GTEX-13JVG-0011-R1a-SM-5KM32 60-69 years, male 6.8
GTEX-1212Z-0011-R1b-SM-5BC72 60-69 years, male 6.7
GTEX-12WSD-0011-R1b-SM-5LZVY 60-69 years, female 6.7
GTEX-12WSE-0011-R1b-SM-5GU4V 20-29 years, male 6.7
GTEX-12WSF-0011-R1a-SM-5DUVI 70-79 years, male 6.7
GTEX-13OW8-0011-R1a-SM-5L3HI 60-69 years, male 6.7
GTEX-11ZTS-0011-R1a-SM-5BC71 60-69 years, female 6.3
GTEX-13N1W-0011-R1b-SM-5MR4T 70-79 years, male 6.1
GTEX-N7MS-0011-R1a-SM-2HMJG 60-69 years, male 6.1
GTEX-T6MN-0011-R1A-SM-32QOY 50-59 years, male 5.9
GTEX-11UD1-0011-R1b-SM-5BC7D 40-49 years, female 5.8
GTEX-13QJC-0011-R1b-SM-5S2UU 60-69 years, female 5.8
GTEX-QMR6-0011-R1A-SM-32PKW 50-59 years, male 5.8
GTEX-13OVL-0011-R1a-SM-5L3H5 50-59 years, male 5.5
GTEX-12WSH-0011-R1a-SM-5GU5V 50-59 years, male 5.4
GTEX-NPJ7-0011-R1a-SM-3GACT 60-69 years, female 5.4
GTEX-139TT-0011-R1a-SM-5LZVD 60-69 years, male 5.3
GTEX-13NYS-0011-R1b-SM-5MR55 60-69 years, male 5.3
GTEX-13S7M-0011-R1b-SM-5PNZE 60-69 years, female 5.3
GTEX-N7MT-0011-R1a-SM-5SI7S 60-69 years, female 5.3
GTEX-11ZVC-0011-R1b-SM-5BC6M 50-59 years, female 5.2
GTEX-S7SE-0011-R1A-SM-2XCDE 50-59 years, male 5.1
GTEX-11ONC-0011-R1a-SM-57WD4 60-69 years, male 5.0
GTEX-13OW7-0011-R1b-SM-5L3HF 50-59 years, male 4.9
GTEX-13SLW-0011-R1a-SM-5S2W7 70-79 years, male 4.8
GTEX-144GL-0011-R1a-SM-5PNZ5 50-59 years, male 4.8
GTEX-13FXS-0011-R1a-SM-5K7U6 50-59 years, male 4.4
GTEX-13O3O-0011-R1b-SM-5KM2K 60-69 years, female 4.4
GTEX-13PDP-0011-R1a-SM-5PNX5 60-69 years, male 4.1
GTEX-13QIC-0011-R1a-SM-5O9CJ 60-69 years, female 4.0
GTEX-13FHP-0011-R1b-SM-5K7XL 50-59 years, male 3.8
GTEX-144GO-0011-R1a-SM-5PNWO 60-69 years, male 3.8
GTEX-13CF2-0011-R1a-SM-5LZY1 60-69 years, male 3.7
GTEX-UTHO-0011-R1A-SM-3GIJO 60-69 years, male 3.7
GTEX-YJ89-0011-R1a-SM-4RGLS 60-69 years, male 3.7
GTEX-NL3H-0011-R1a-SM-48TDJ 60-69 years, male 3.6
GTEX-13NZA-0011-R1b-SM-5LUAF 60-69 years, male 3.4
GTEX-13RTL-0011-R1a-SM-5PNZ8 40-49 years, male 3.4
GTEX-Y8DK-0011-R1A-SM-4RGLO 60-69 years, male 3.3
GTEX-ZVZQ-0011-R1a-SM-57WBU 60-69 years, female 2.9
GTEX-12WSM-0011-R1a-SM-5LZW6 60-69 years, male 2.8
GTEX-NPJ8-0011-R1a-SM-33HCB 40-49 years, male 2.8
GTEX-13112-0011-R1b-SM-5HL7K 50-59 years, male 2.7
GTEX-139T8-0011-R1a-SM-5HL75 60-69 years, male 2.7
GTEX-1399T-0011-R1b-SM-5DUWN 60-69 years, male 2.6
GTEX-ZF28-0011-R1a-SM-4WWD1 60-69 years, male 2.4
GTEX-12WSB-0011-R1b-SM-5P9EY 60-69 years, female 2.3
GTEX-13OW5-0011-R1b-SM-5L3GE 60-69 years, male 2.1
GTEX-145LU-0011-R1a-SM-5Q5CE 50-59 years, male 2.1
GTEX-13FTY-0011-R1a-SM-5LZXE 40-49 years, female 1.8
GTEX-ZE7O-0011-R1a-SM-57WDM 50-59 years, female 1.1
Show all

HIPPOCAMPUS - FANTOM5 CAGEi

Tissue data obtained through Cap Analysis of Gene Expression (CAGE) are reported as Tags Per Million, generated by the FANTOM5 project. More information can be found here.

Read more

Average Tags Per Million

186.0

FANTOM5 sample id

Sample description

Tags Per Million

Hippocampus
Tags Per Million: 169.8
FF:10169-103B7 60 years, female 171.2
FF:10153-102I9 76 years, female 168.3

Contact

  • BLOG
  • PRESS ROOM
  • contact@proteinatlas.org

The Project

  • INTRODUCTION
  • ORGANIZATION
  • PUBLICATIONS
  • DOWNLOADABLE DATA

The Human Protein Atlas

  • ANTIBODY AVAILABILITY
  • LICENCE & CITATION
  • HELP & FAQ
The Human Protein Atlas project is funded
by the Knut & Alice Wallenberg foundation.