The Human Protein Atlas
The Human Protein Atlas (HPA) is a Swedish-based program started in 2003 with the aim to map of all
the human proteins in cells, tissues and organs using integration of various omics technologies,
including antibody-based imaging, mass spectrometry-based proteomics, transcriptomics and systems
biology. All the data in the knowledge resource is open access to allow scientists both in academia
and industry to freely access the data for exploration of the human proteome.
The Human Protein Atlas consists of three separate parts, each focusing on a particular
aspect of the genome-wide analysis of the human proteins; the Tissue Atlas showing the distribution of
the proteins across all major tissues and organs in the human body, the Cell Atlas showing the subcellular
localization of proteins in single cells, and finally the Pathology Atlas showing the impact of protein
levels for survival of patients with cancer. The Human Protein Atlas program has already contributed to
several thousands of publications in the field of human biology and disease and it is
selected by the organization ELIXIR (www.elixir-europe.org) as a European core resource due to its fundamental
importance for a wider life science community. The HPA consortium is funded by the Knut and Alice Wallenberg
Foundation.
Uhlén M et al, 2015. Tissue-based map of the human proteome. Science
PubMed: 25613900 DOI: 10.1126/science.1260419 Thul PJ et al, 2017. A subcellular map of the human proteome. Science.
PubMed: 28495876 DOI: 10.1126/science.aal3321 Uhlen M et al, 2017. A pathology atlas of the human cancer transcriptome. Science.
PubMed: 28818916 DOI: 10.1126/science.aan2507 The full publication list is available here.
The tissue atlas
The Tissue Atlas shows the expression and localization of human proteins across tissues and organs, based on deep
sequencing of RNA (RNA-seq) from 37 major different normal tissue types and immunohistochemistry on tissue microarrays
containing 44 different tissue types. Altogether 76 different cell types,
corresponding to 44 normal human tissue types
covering all major parts of the human body, have been analyzed manually and the data is presented as histology-based
annotation of protein expression levels. The antibody-based protein profiles are qualitative and describe the spatial
distribution, cell type specificity and the rough relative abundance of proteins in these tissues, whereas the mRNA data
provide quantitative data on the average gene expression within an entire tissue. For each gene, the immunohistochemical
staining profile is matched with mRNA data and gene/protein characterization data to yield an "annotated protein expression"
profile. Example:
Example:
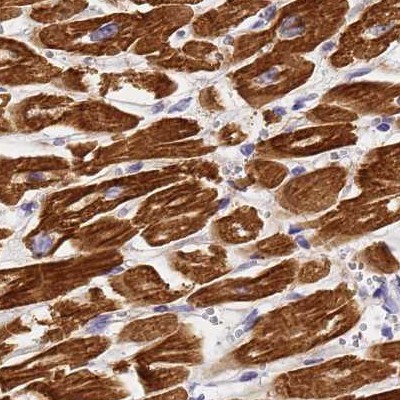
MYL7
Myosin, light chain 7, regulatory.
Selective cytoplasmic expression in cardiomyocytes at the protein level, highly tissue enriched in heart muscle at the mRNA level.
|
|
The mouse brain atlas (under development)
In addition to the standard tissue setup, extended tissue profiling is performed for selected proteins, to give a more
complete overview on where the protein is expressed. Extended tissue samples include mouse brain, human lactating breast,
eye, and additional samples of adrenal gland, skin and brain.
The mouse brain atlas provides a more extended overview of the brain proteome. In the standard analysis performed in the
Tissue Atlas three forebrain regions (cerebral cortex, hippocampus, and caudate) and one hindbrain (cerebellum) region are
included. Immunofluorescencently labled full mouse brain sections provide a more extensive overview presenting more brain
areas and cell types. A selected set of brain relevant genes are profiled in the mouse brain providing detailed information
on the regional and cellular location of proteins in the mammalian brain.
Example:
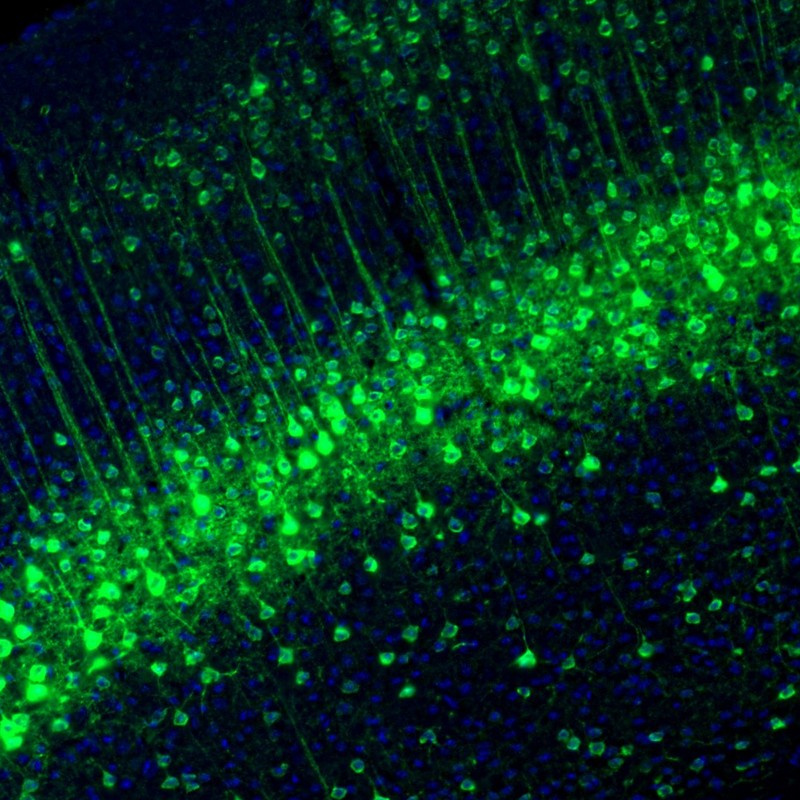
NECAB1
N-terminal EF-hand calcium binding protein 1.
Subsets of neurons showed distinct positivity in cell bodies and dendrites. Main location of the positive neurons is layer 4 of the cerebral cortex.
|
|
The cell atlas
The Cell Atlas provides high-resolution insights in the spatial distribution of proteins within cells.
Firstly, it contains mRNA expression profiles from a diverse panel of human-derived cell lines (n=56) representing different
germ layers and tissues. Secondly, the atlas contains high-resolution, multicolour images of immunofluorescently
labeled cells that detail the subcellular distribution pattern of proteins in these cells. By default U-2OS cells
and 2 based on expression selected cell lines are probed with each antibody. The cells are stained in a standardized
way where the antibody of interest is visualized in green,
the microtubules red, the endoplasmic reticulum yellow, and nuclei counterstained in blue. The images are manually annotated
in terms of spatial distribution to 30 different cellular structures representing 14 major organelles. The annotated locations
for every protein are classified as main and additional, and assigned a reliability score.
Example:
CCNB1
Cyclin B1.
Protein localized to the cytosol in human and mouse cells, and expressed in a cell cycle dependent manner. The location has been validated by siRNA mediated gene silencing, analysis of GFP-tagged protein and paired antibodies.
|
|
The pathology atlas
The Human Pathology Atlas (published in Science) is based on a systems-based analysis of the transcriptome
of 17 main cancer types using data from 8,000 patients. In addition, we show a new concept to present patient
survival data, called Interactive Survival Scatter plots, and in the atlas, we present more than 400,000 such
plots. A national supercomputer center were used to analyze more than 2.5 petabytes of underlying publicly
available data from the Cancer Genome Atlas (TCGA) to generate more than 900,000 survival plots describing the
consequence of RNA and protein levels on clinical survival. The Pathology Atlas also contains 5 million pathology-based
images generated by the Human Protein Atlas consortium. The Research Article in Science reports several important
findings related to cancer biology and treatment. Firstly, a large fraction of genes is differentially expressed
in cancers - and in many cases - have an impact on overall patient survival. The research also showed that gene
expression patterns of individual tumors varied considerably, and could exceed the variation observed between
different cancer types. Shorter patient survival was generally associated with up-regulation of genes involved
in mitosis and cell growth, and down-regulation of genes involved in cellular differentiation. The data allowed
the researchers to generate personalized genome-scale metabolic models for cancer patients to identify key genes
involved in tumor growth.
Example:
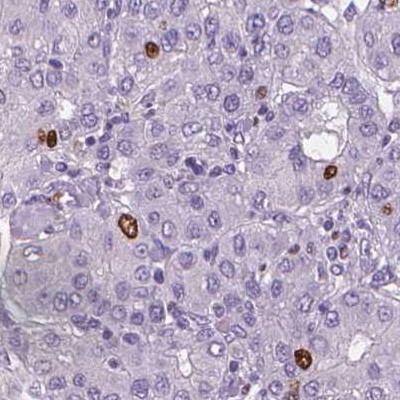
MKI67
Marker of proliferation Ki-67.
Nuclear expression in varying fractions of tumor cells in all cancer types at protein level and expressed in all cancers at mRNA level. High expression of this gene is associated with unfavourable prognosis in renal, liver and pancreatic cancer.
|
|
Background and history
The Human Protein Atlas project was initiated in 2003 by funding from the Knut and Alice Wallenberg foundation. Primarily based in Sweden,
the Human Protein Atlas project involves the joint efforts of the Royal Institute of Technology in Stockholm, Uppsala University,
Uppsala Akademiska University Hospital, and more recently also Science for Life Laboratory based in both Uppsala and Stockholm.
Formal collaborations are with groups in India, South Korea, Japan, China, Germany, France, Switzerland, USA, Canada, Denmark, Finland,
The Netherlands, Spain, and Italy.
The pathologists and staff at the Pathology Clinic, Uppsala University Hospital, Uppsala, Sweden, are greatly acknowledged for all efforts regarding handling and diagnostics of the tissues used in the Human Protein Atlas. Dr Sanjay Navani and Lab Surgpath, Mumbai, India, are also acknowledged for the major contribution regarding annotation of immunohistochemically stained normal and cancer tissues.
The first version of the Human Protein Atlas website was launched in 2005 and contained protein expression data
based on approximately 700 antibodies. Since then, each new release has included more
data and also added new functionalities and new features to the website. Important additions are the inclusion of cell-line data in version 2, and the inclusion of confocal images showing subcellular localizations in version 3.
Version 3 also included a new search function that allowed advanced query based searches. In version 4, the overall database structure was shifted from a previously antibody-centric structure,
to a gene-centric structure in order to include information on all genes predicted by Ensembl. The next major restructuring came in 2010 with the version 7
when the concept of annotated protein expression for paired antibodies (two independent antibodies directed against different, non-overlapping epitopes on the same protein)
was introduced. In 2013, the version 12 of the protein atlas database was complemented with transcriptomics profiles from 27 normal tissues,
and the format with four sub-atlases was introduced. Version 13 was released at end of 2014 and included an analysis of all major organ and tissues in the human body using
transcriptomics and antibody-based profiling.
The results were summarized on interactive knowledge-pages divided into 7 human proteomes and 27 tissues and organs.
In version 14, a new mouse brain atlas was introduced, and in version 15 RNA-seq data from the Genotype-Tissue Expression (GTEx)
consortium was included. In version16, a new Cell Atlas was launched with subcellular localization corresponding to over 12,000 protein-coding genes, together with a new approach for visualization of antibody validation and the inclusion of transcriptomics data from the FANTOM5 program.
Release history is found here
Number of gene/antibodies included per new release
|


