We use cookies to enhance the usability of our website. If you continue, we'll assume that you are happy to receive all cookies. More information. Don't show this again.
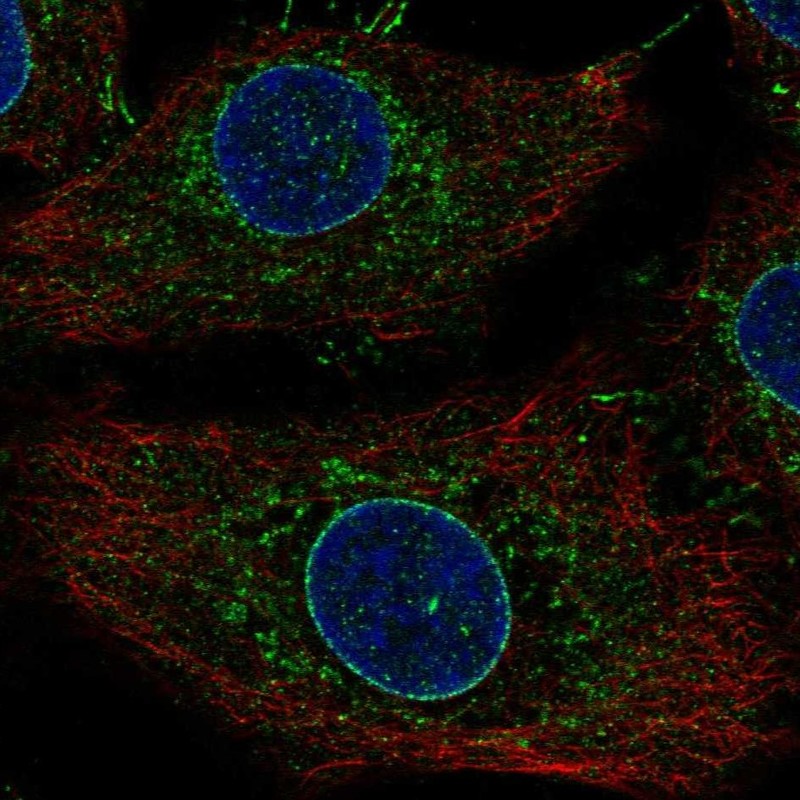
Immunofluorescent staining of human cell line A549 shows localization to nuclear membrane, mitochondria & cell junctions.
Antibody dilution
1:36
Literature conformity
The subcellular location is supported by literature.
IMMUNOHISTOCHEMISTRY
Antibody HPA036917
Antibody HPA044866
Antibody HPA078535
Standard validation
Approved
Approved
Figure description
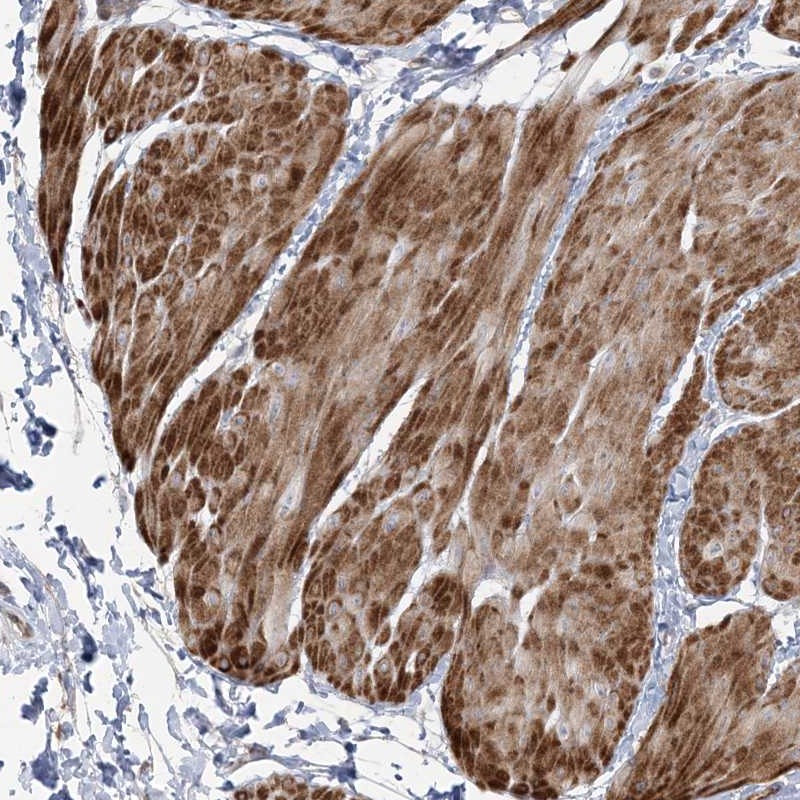
Immunohistochemical staining of human smooth muscle shows strong cytoplasmic positivity in smooth muscle cells.
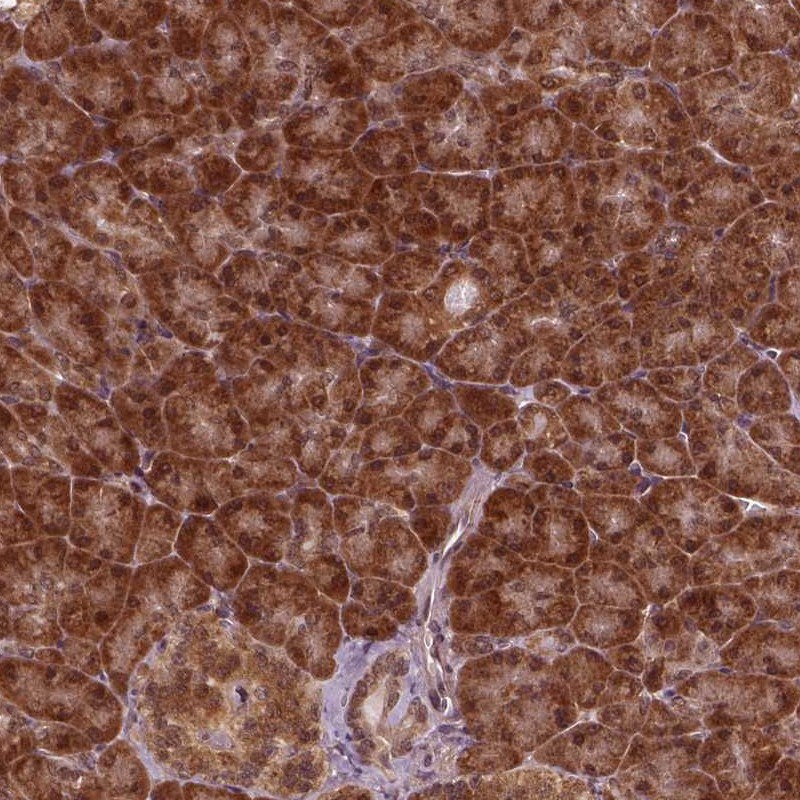
Immunohistochemical staining of human pancreas shows strong cytoplasmic and nuclear positivity in exocrine glandular cells.
Expression
RNA: detected in 37 tissues Protein: detected in 54 cell types
RNA: detected in 37 tissues Protein: detected in 81 cell types
Retrieval
HIER pH6
HIER pH6
Antibody dilution
1:850
1:3000
Literature conformity
Partly consistent with gene/protein characterization data.
Partly consistent with gene/protein characterization data.
RNA consistency
Mainly consistent with RNA expression data.
Mainly consistent with RNA expression data.
WESTERN BLOT
Antibody HPA036917
Antibody HPA044866
Antibody HPA078535
Standard validation
Supported
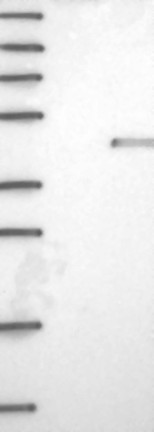
Single band corresponding to the predicted size in kDa (+/-20%).
Uncertain
Analysis performed using a standard panel of samples. Weak band of predicted size but with additional bands of higher intensity also present.
Figure description
Lane 1: Marker [kDa] 250, 130, 95, 72, 55, 36, 28, 17, 10 Lane 2: Negative control (vector only transfected HEK293T lysate) Lane 3: Over-expression Lysate (Co-expressed with a C-terminal myc-DDK tag (~3.1 kDa) in mammalian HEK293T cells, LY405100)
Target mass (kDa)
39.1, 33.8
39.1, 33.8, 31.5, 23
Antibody dilution
1:250
1:250
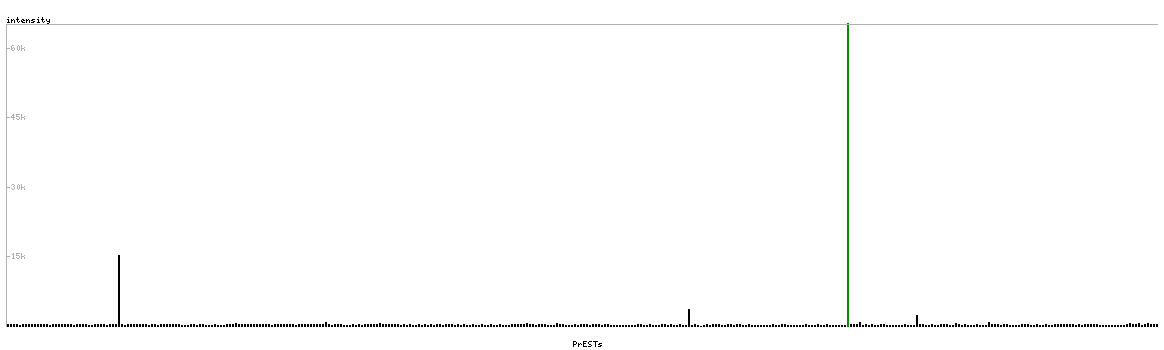
PROTEIN ARRAY
Antibody HPA036917
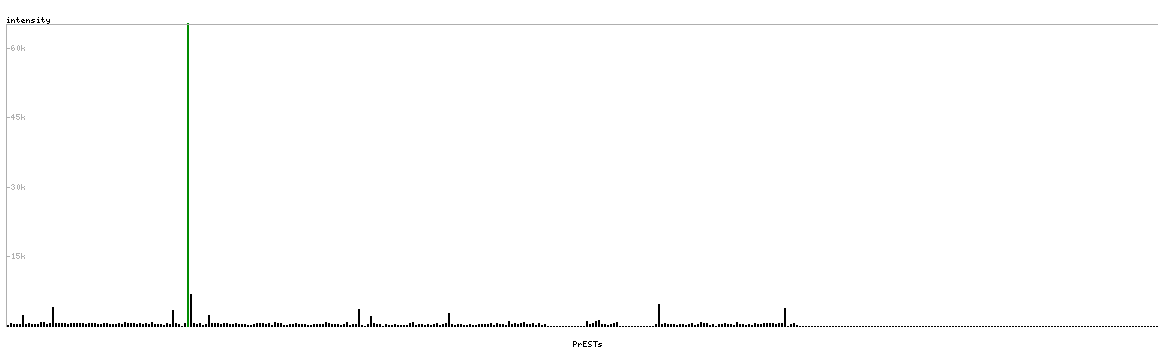
Antibody HPA044866
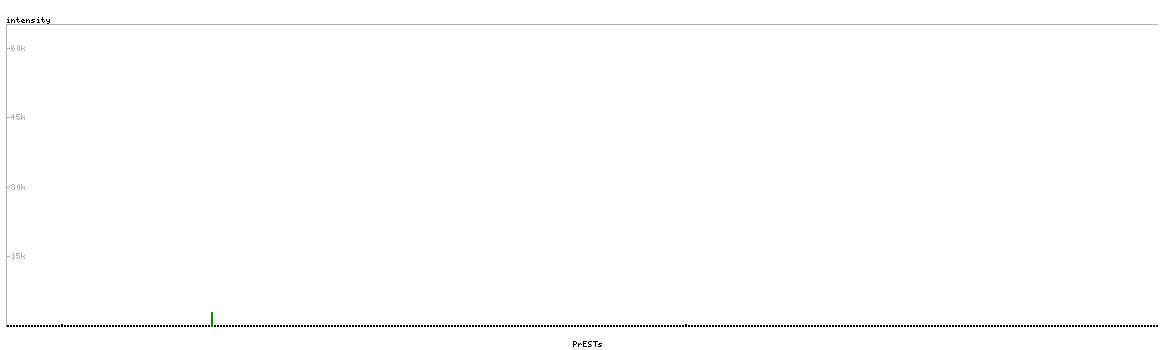
Antibody HPA078535
Standard validation
Approved
Pass with quality comment low specificity (binding to 1-2 PrESTs >15% and <40%).
Supported
Pass with single peak corresponding to interaction only with its own antigen.
Supported
Pass with single peak corresponding to interaction only with its own antigen.
Figure description
Antibody specificity analysis with protein arrays. Predicted and matching interactions are shown in green.
Antibody specificity analysis with protein arrays. Predicted and matching interactions are shown in green.
Antibody specificity analysis with protein arrays. Predicted and matching interactions are shown in green.