TISSUE
CELL
PATHOLOGY
Antibody validation
Dictionary
VAGINA - Expression summary
Protein expression
RNA expression
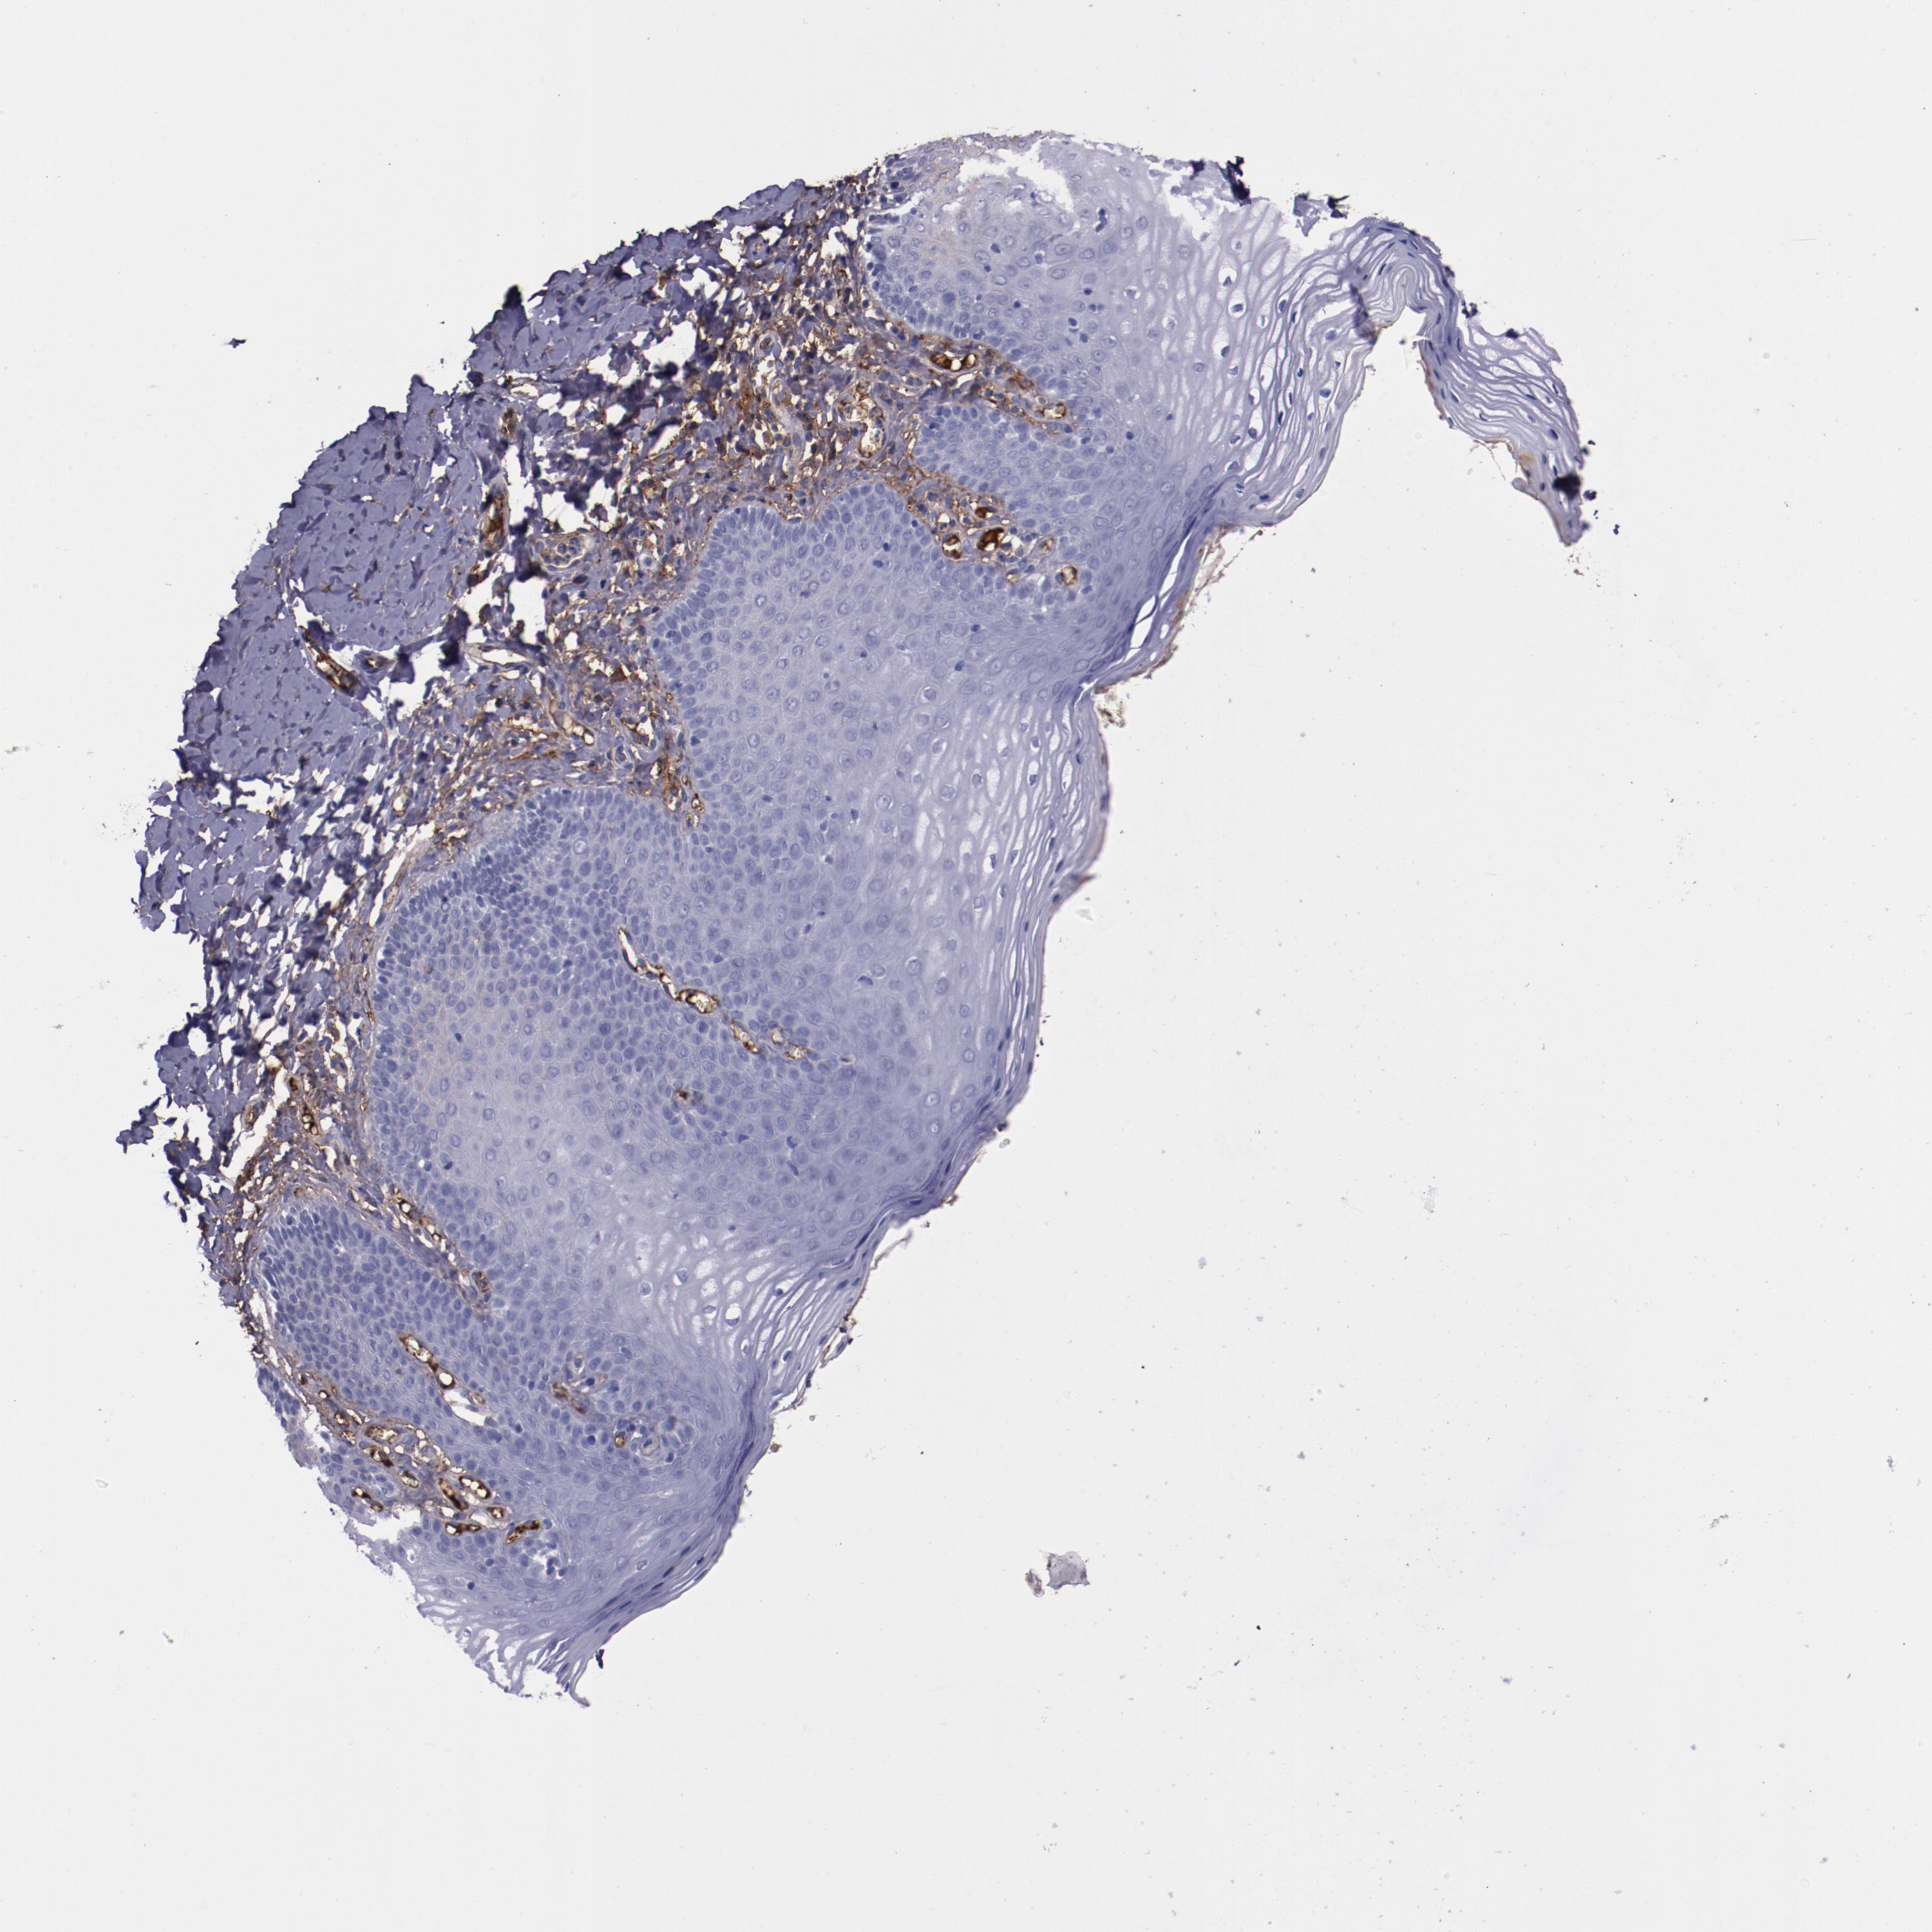
VAGINA - Annotated protein expression
Annotated proteinexpression
Antibody staining
Antibody HPA002265
Antibody CAB017621
Squamous epithelial cells
VAGINA - HPA RNA-seq
Pending HPA RNA-seq analysis
VAGINA - GTEx RNA-seq
Average RPKM
136.9
GTEx sample id
Sample description
RPKM
VAGINA - FANTOM5 CAGE
Average Tags Per Million
503.3
FANTOM5 sample id
Tags Per Million