We use cookies to enhance the usability of our website. If you continue, we'll assume that you are happy to receive all cookies. More information. Don't show this again.
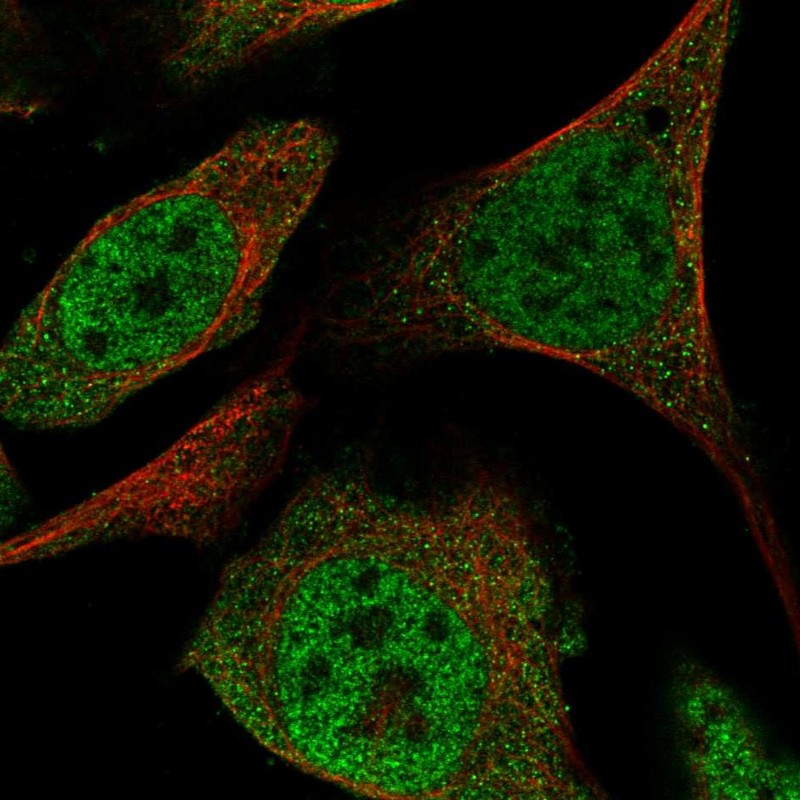
Immunofluorescent staining of human cell line U-2 OS shows localization to nucleoplasm & cytosol.
Antibody dilution
1:50
Literature conformity
The subcellular location is not consistent with literature.
IMMUNOHISTOCHEMISTRY
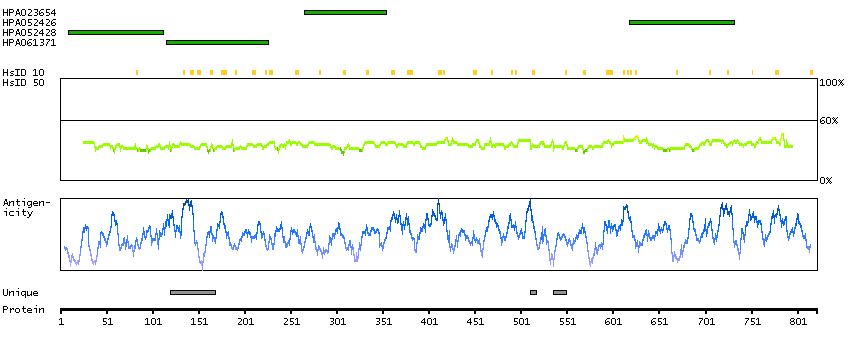
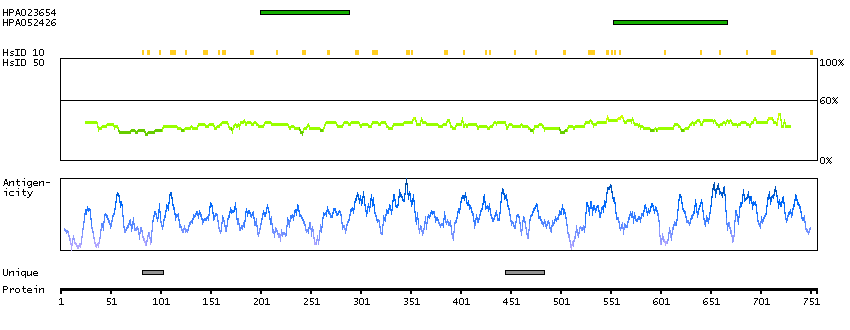
Antibody HPA023654
Antibody HPA052426
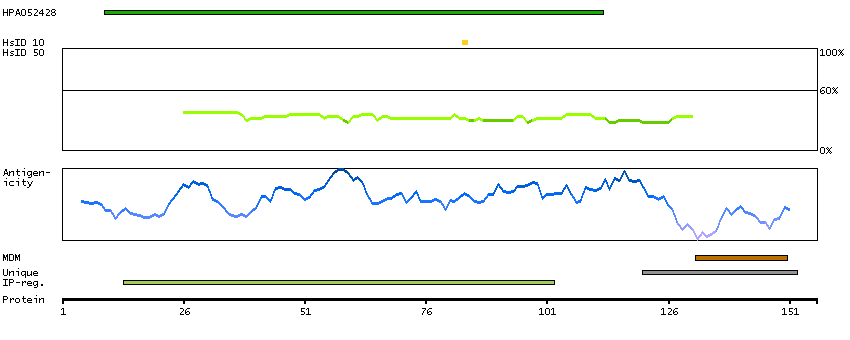
Antibody HPA052428
Antibody HPA061371
Standard validation
Approved
Approved
Approved
Figure description
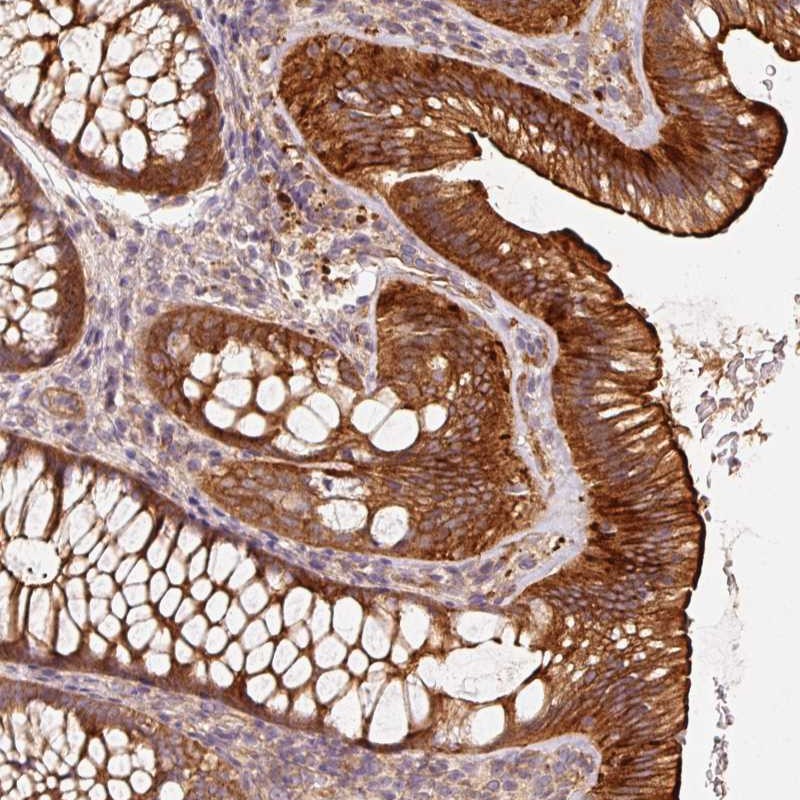
Immunohistochemical staining of human colon shows strong cytoplasmic and membranous positivity in glandular cells.
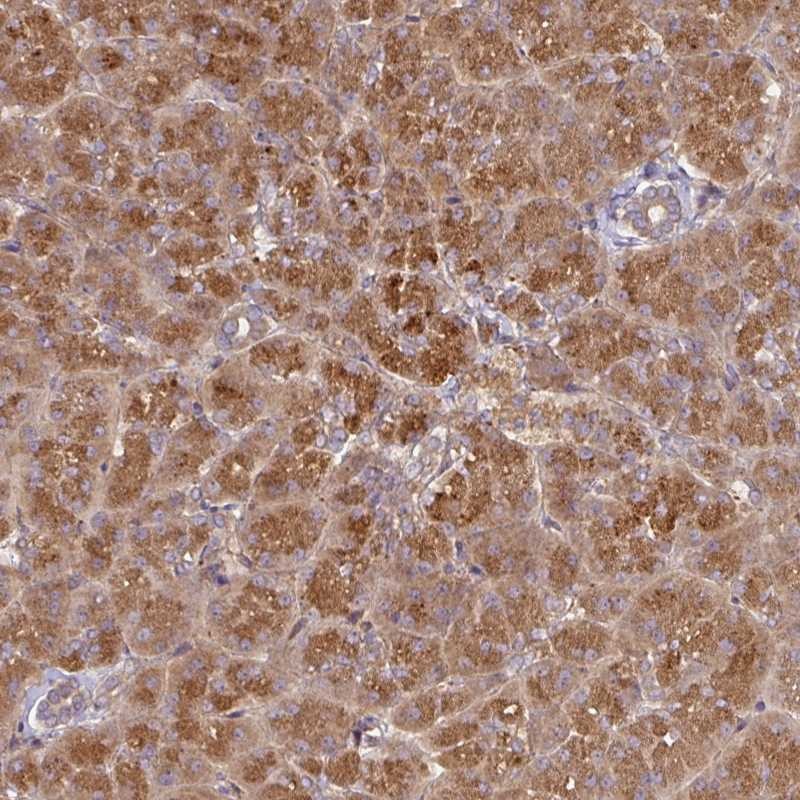
Immunohistochemical staining of human pancreas shows strong cytoplasmic positivity in exocrine glandular cells.
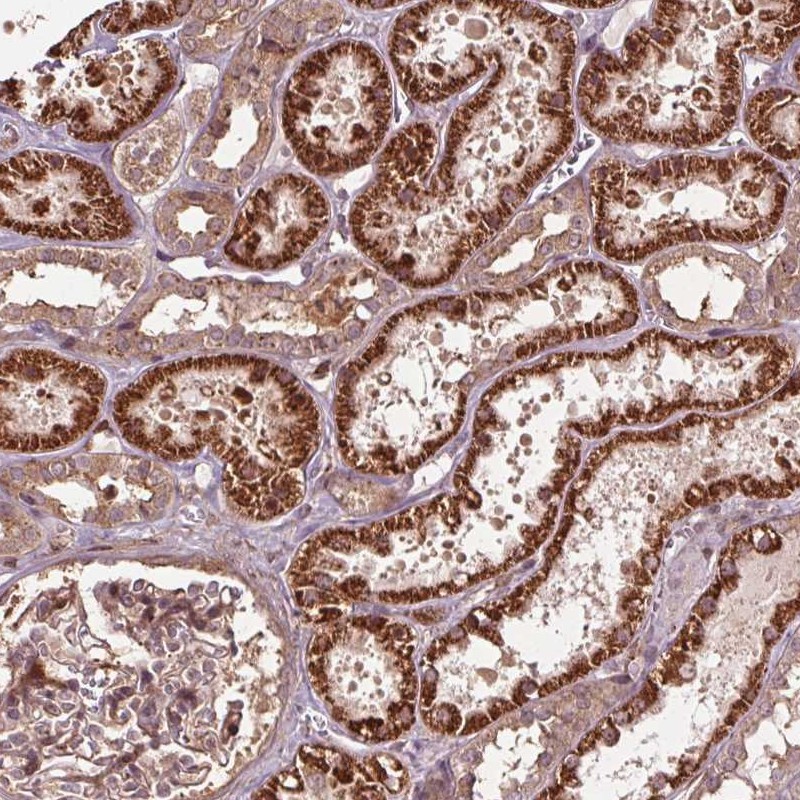
Immunohistochemical staining of human kidney shows strong cytoplasmic positivity in renal tubules.
Expression
RNA: detected in 37 tissues Protein: detected in 59 cell types
RNA: detected in 37 tissues Protein: detected in 70 cell types
RNA: detected in 37 tissues Protein: detected in 59 cell types
Retrieval
HIER pH6
HIER pH6
HIER pH6
Antibody dilution
1:250
1:40
1:250
Literature conformity
No avaliable gene/protein characterization data.
No avaliable gene/protein characterization data.
No avaliable gene/protein characterization data.
RNA consistency
Mainly consistent with RNA expression data.
Mainly consistent with RNA expression data.
Mainly consistent with RNA expression data.
WESTERN BLOT
Antibody HPA023654
Antibody HPA052426
Antibody HPA052428
Antibody HPA061371
Standard validation
Supported
Analysis performed using a standard panel of samples. Band of predicted size in kDa (+/-20%) with additional bands present.
Supported
Analysis performed using a standard panel of samples. Single band corresponding to the predicted size in kDa (+/-20%).
Uncertain
Analysis performed using a standard panel of samples. Single band larger than predicted size in kDa (+20%) but partly supported by experimental and/or bioinformatic data.
Uncertain
Analysis performed using a standard panel of samples. Only bands not corresponding to the predicted size.
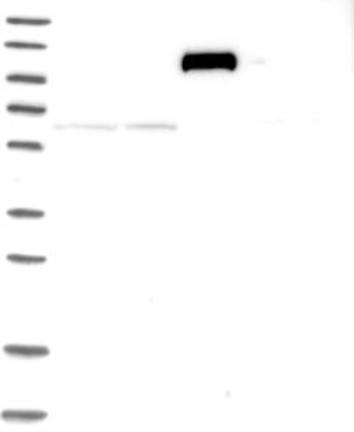
Figure description
Lane 1: Marker [kDa] 230, 130, 95, 72, 56, 36, 28, 17, 11 Lane 2: RT4 Lane 3: U-251 MG Lane 4: Human Plasma Lane 5: Liver Lane 6: Tonsil
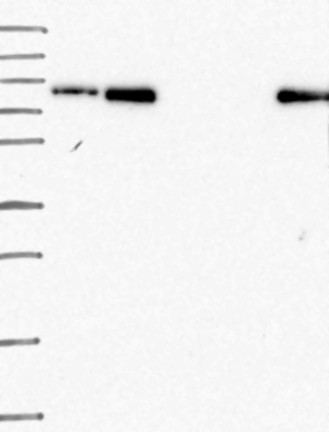
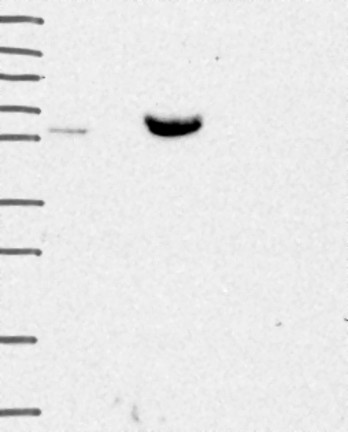
Lane 1: Marker [kDa] 250, 130, 95, 72, 55, 36, 28, 17, 10 Lane 2: RT4 Lane 3: U-251 MG Lane 4: Human Plasma Lane 5: Liver Lane 6: Tonsil
Lane 1: Marker [kDa] 250, 130, 95, 72, 55, 36, 28, 17, 10 Lane 2: RT4 Lane 3: U-251 MG Lane 4: Human Plasma Lane 5: Liver Lane 6: Tonsil
Target mass (kDa)
95.3, 87.9
95.3, 87.9
95.3, 17.9
95.3
Antibody dilution
1:250
1:840
1:550
1:130
PROTEIN ARRAY
Antibody HPA023654
Antibody HPA052426
Antibody HPA052428
Antibody HPA061371
Standard validation
Supported
Pass with single peak corresponding to interaction only with its own antigen.
Approved
Pass with quality comment low specificity (binding to 1-2 PrESTs >15% and <40%).
Supported
Pass with single peak corresponding to interaction only with its own antigen.
Supported
Pass with single peak corresponding to interaction only with its own antigen.
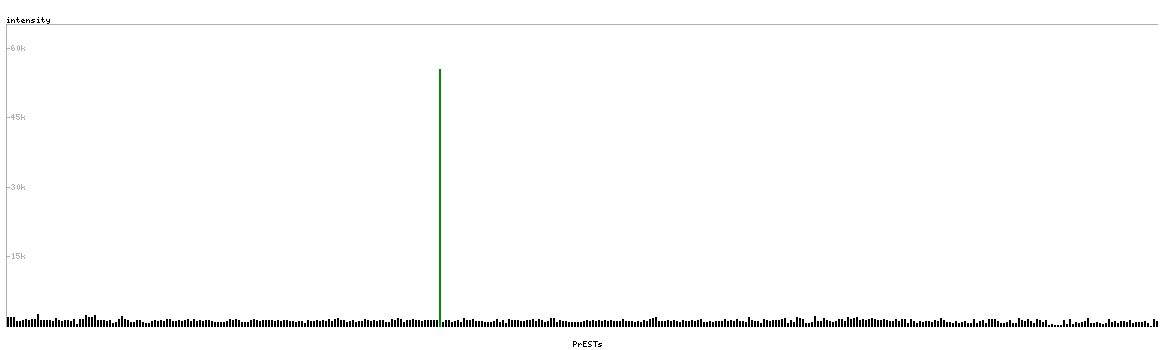
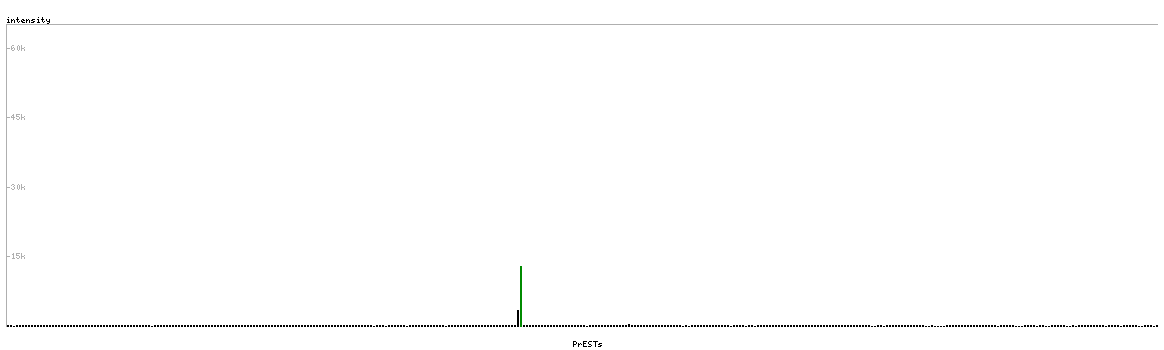
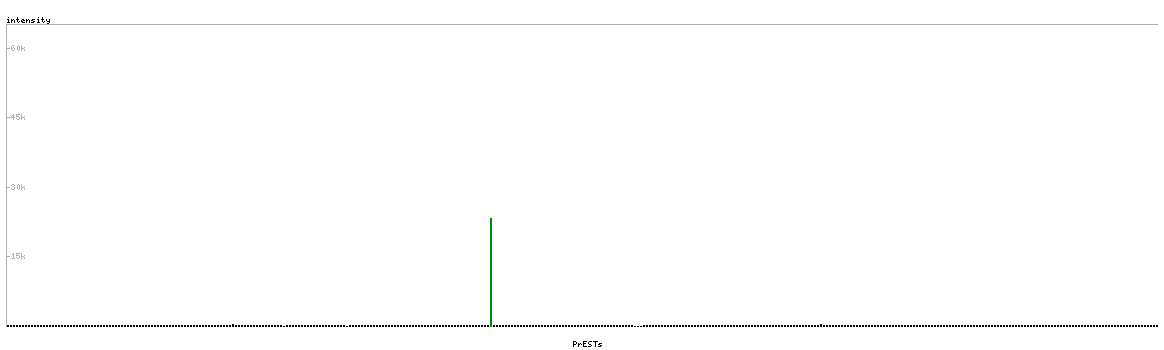
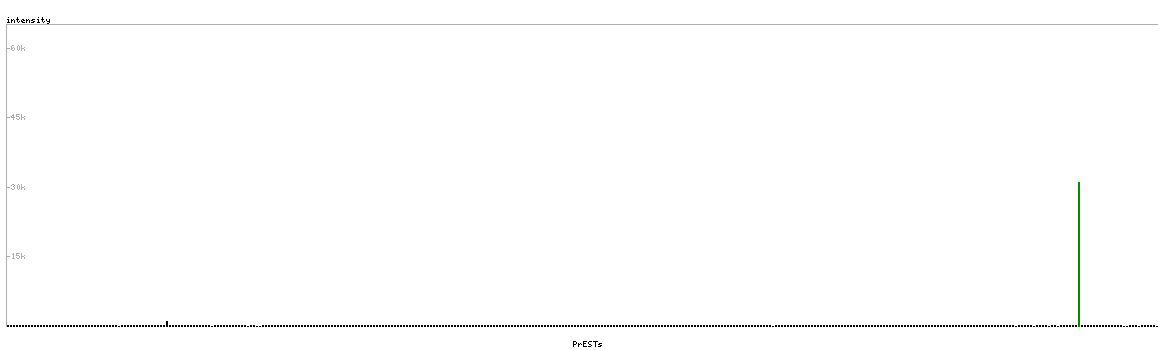
Figure description
Antibody specificity analysis with protein arrays. Predicted and matching interactions are shown in green.
Antibody specificity analysis with protein arrays. Predicted and matching interactions are shown in green.
Antibody specificity analysis with protein arrays. Predicted and matching interactions are shown in green.
Antibody specificity analysis with protein arrays. Predicted and matching interactions are shown in green.