We use cookies to enhance the usability of our website. If you continue, we'll assume that you are happy to receive all cookies. More information. Don't show this again.
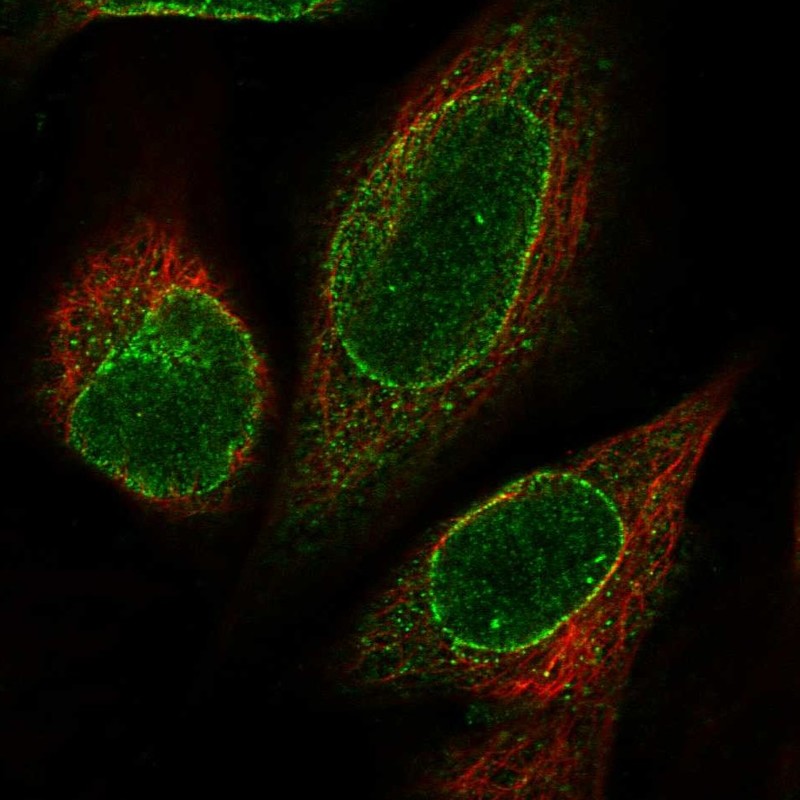
Immunofluorescent staining of human cell line U-2 OS shows localization to nuclear membrane.
Antibody dilution
1:44
Literature conformity
The subcellular location is partly supported by literature or no literature is available.
IMMUNOHISTOCHEMISTRY
Antibody HPA041580
Antibody HPA042010
Standard validation
Uncertain
Uncertain
Figure description
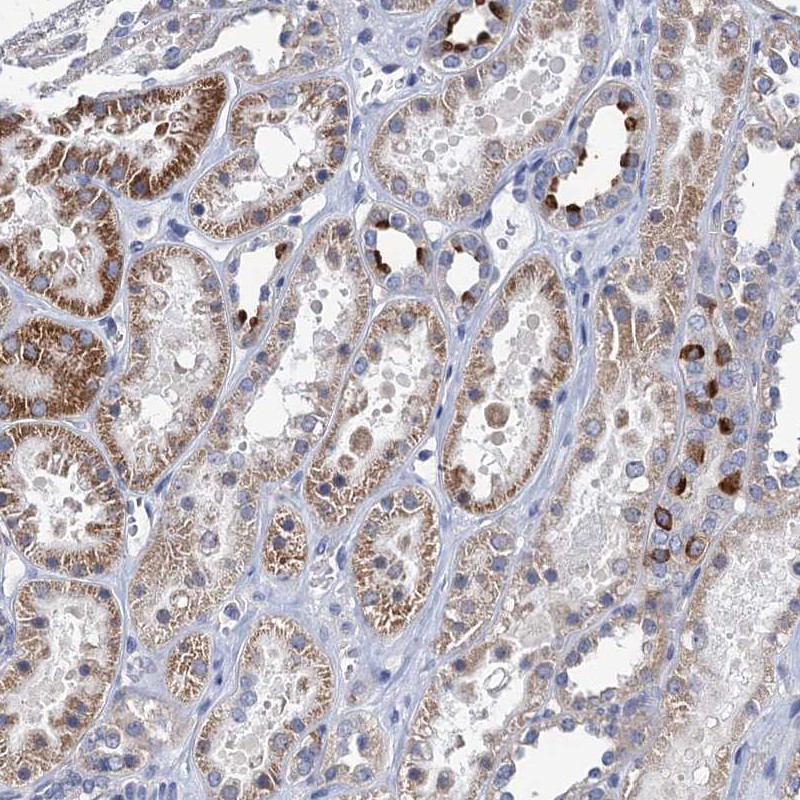
Immunohistochemical staining of human kidney shows strong cytoplasmic positivity in a subset of cells in renal tubules.
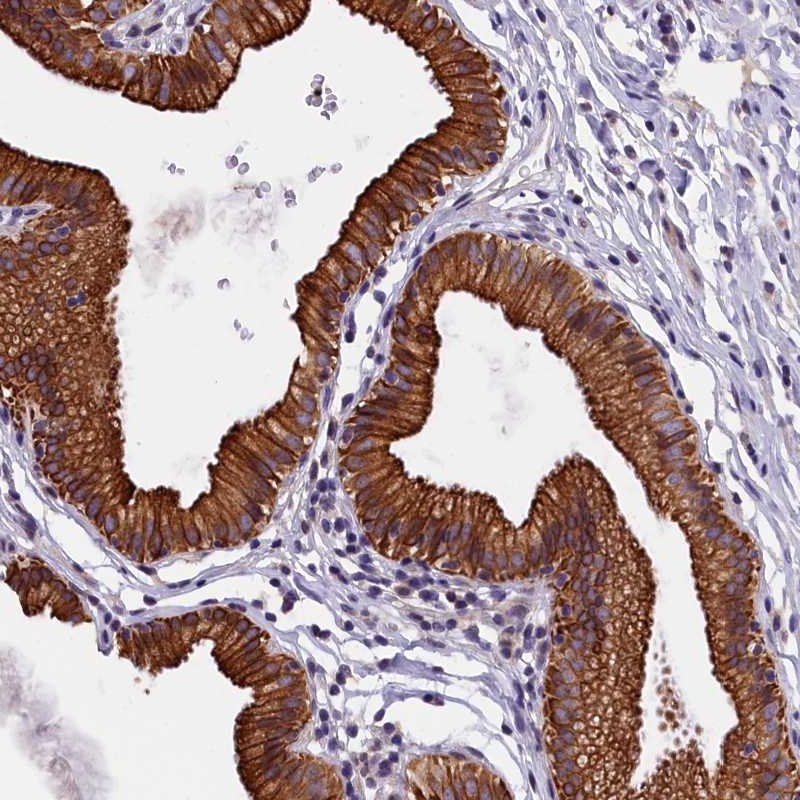
Immunohistochemical staining of human gall bladder shows strong cytoplasmic and membranous positivity in glandular cells.
Expression
RNA: detected in 0 tissues Protein: detected in 14 cell types
RNA: detected in 0 tissues Protein: detected in 37 cell types
Retrieval
HIER pH6
HIER pH6
Antibody dilution
1:35
1:300
Literature conformity
No avaliable gene/protein characterization data.
No avaliable gene/protein characterization data.
RNA consistency
Not consistent with RNA expression data.
Not consistent with RNA expression data.
WESTERN BLOT
Antibody HPA041580
Antibody HPA042010
Standard validation
Uncertain
Analysis performed using a standard panel of samples. Current setup is not applicable due to low RNA count.
Supported
Single band corresponding to the predicted size in kDa (+/-20%).
Figure description
Lane 1: Marker [kDa] 250, 130, 95, 72, 55, 36, 28, 17, 10 Lane 2: Negative control (vector only transfected HEK293T lysate) Lane 3: Over-expression Lysate (Co-expressed with a C-terminal myc-DDK tag (~3.1 kDa) in mammalian HEK293T cells, LY408604)
Target mass (kDa)
30.3, 25
25, 23.9
Antibody dilution
1:250
1:250
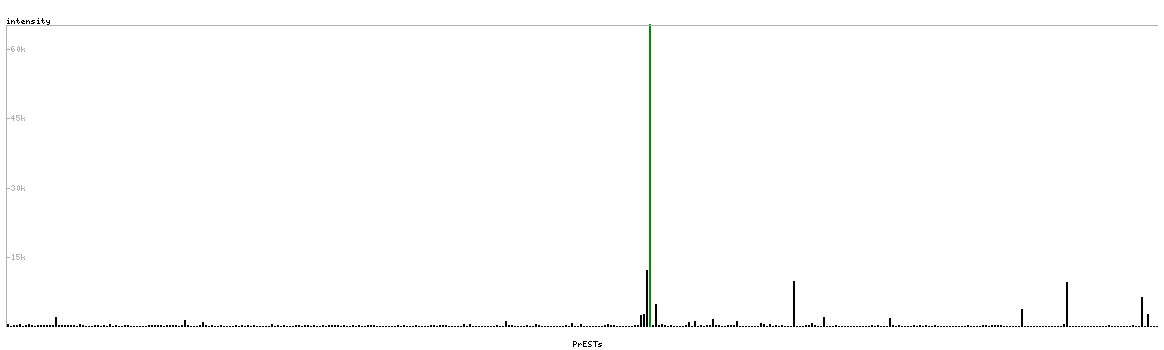
PROTEIN ARRAY
Antibody HPA041580
Antibody HPA042010
Standard validation
Supported
Pass with single peak corresponding to interaction only with its own antigen.
Approved
Pass with quality comment low specificity (binding to 1-2 PrESTs >15% and <40%).
Figure description
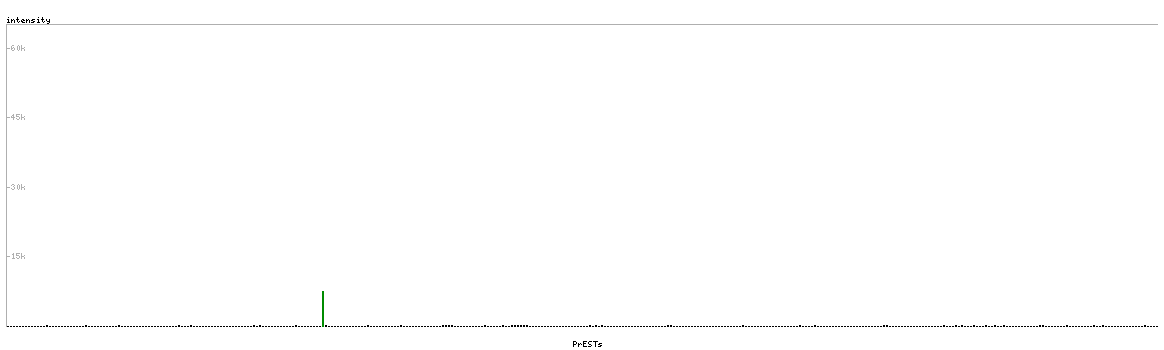
Antibody specificity analysis with protein arrays. Predicted and matching interactions are shown in green.
Antibody specificity analysis with protein arrays. Predicted and matching interactions are shown in green.