- THE HUMAN PROTEOME
- THE HUMAN TISSUES
- THE HUMAN CELL
- HUMAN PATHOLOGY
- PROTEIN CLASSES
- PROTEIN EVIDENCE
- NEWS
- BLOG
- EVENTS
- PRESS ROOM
- LEARN
- DICTIONARY
- METHODS
- CELL LINES
|
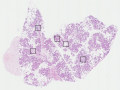
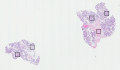
TISSUE ATLAS
PRIMARY DATA
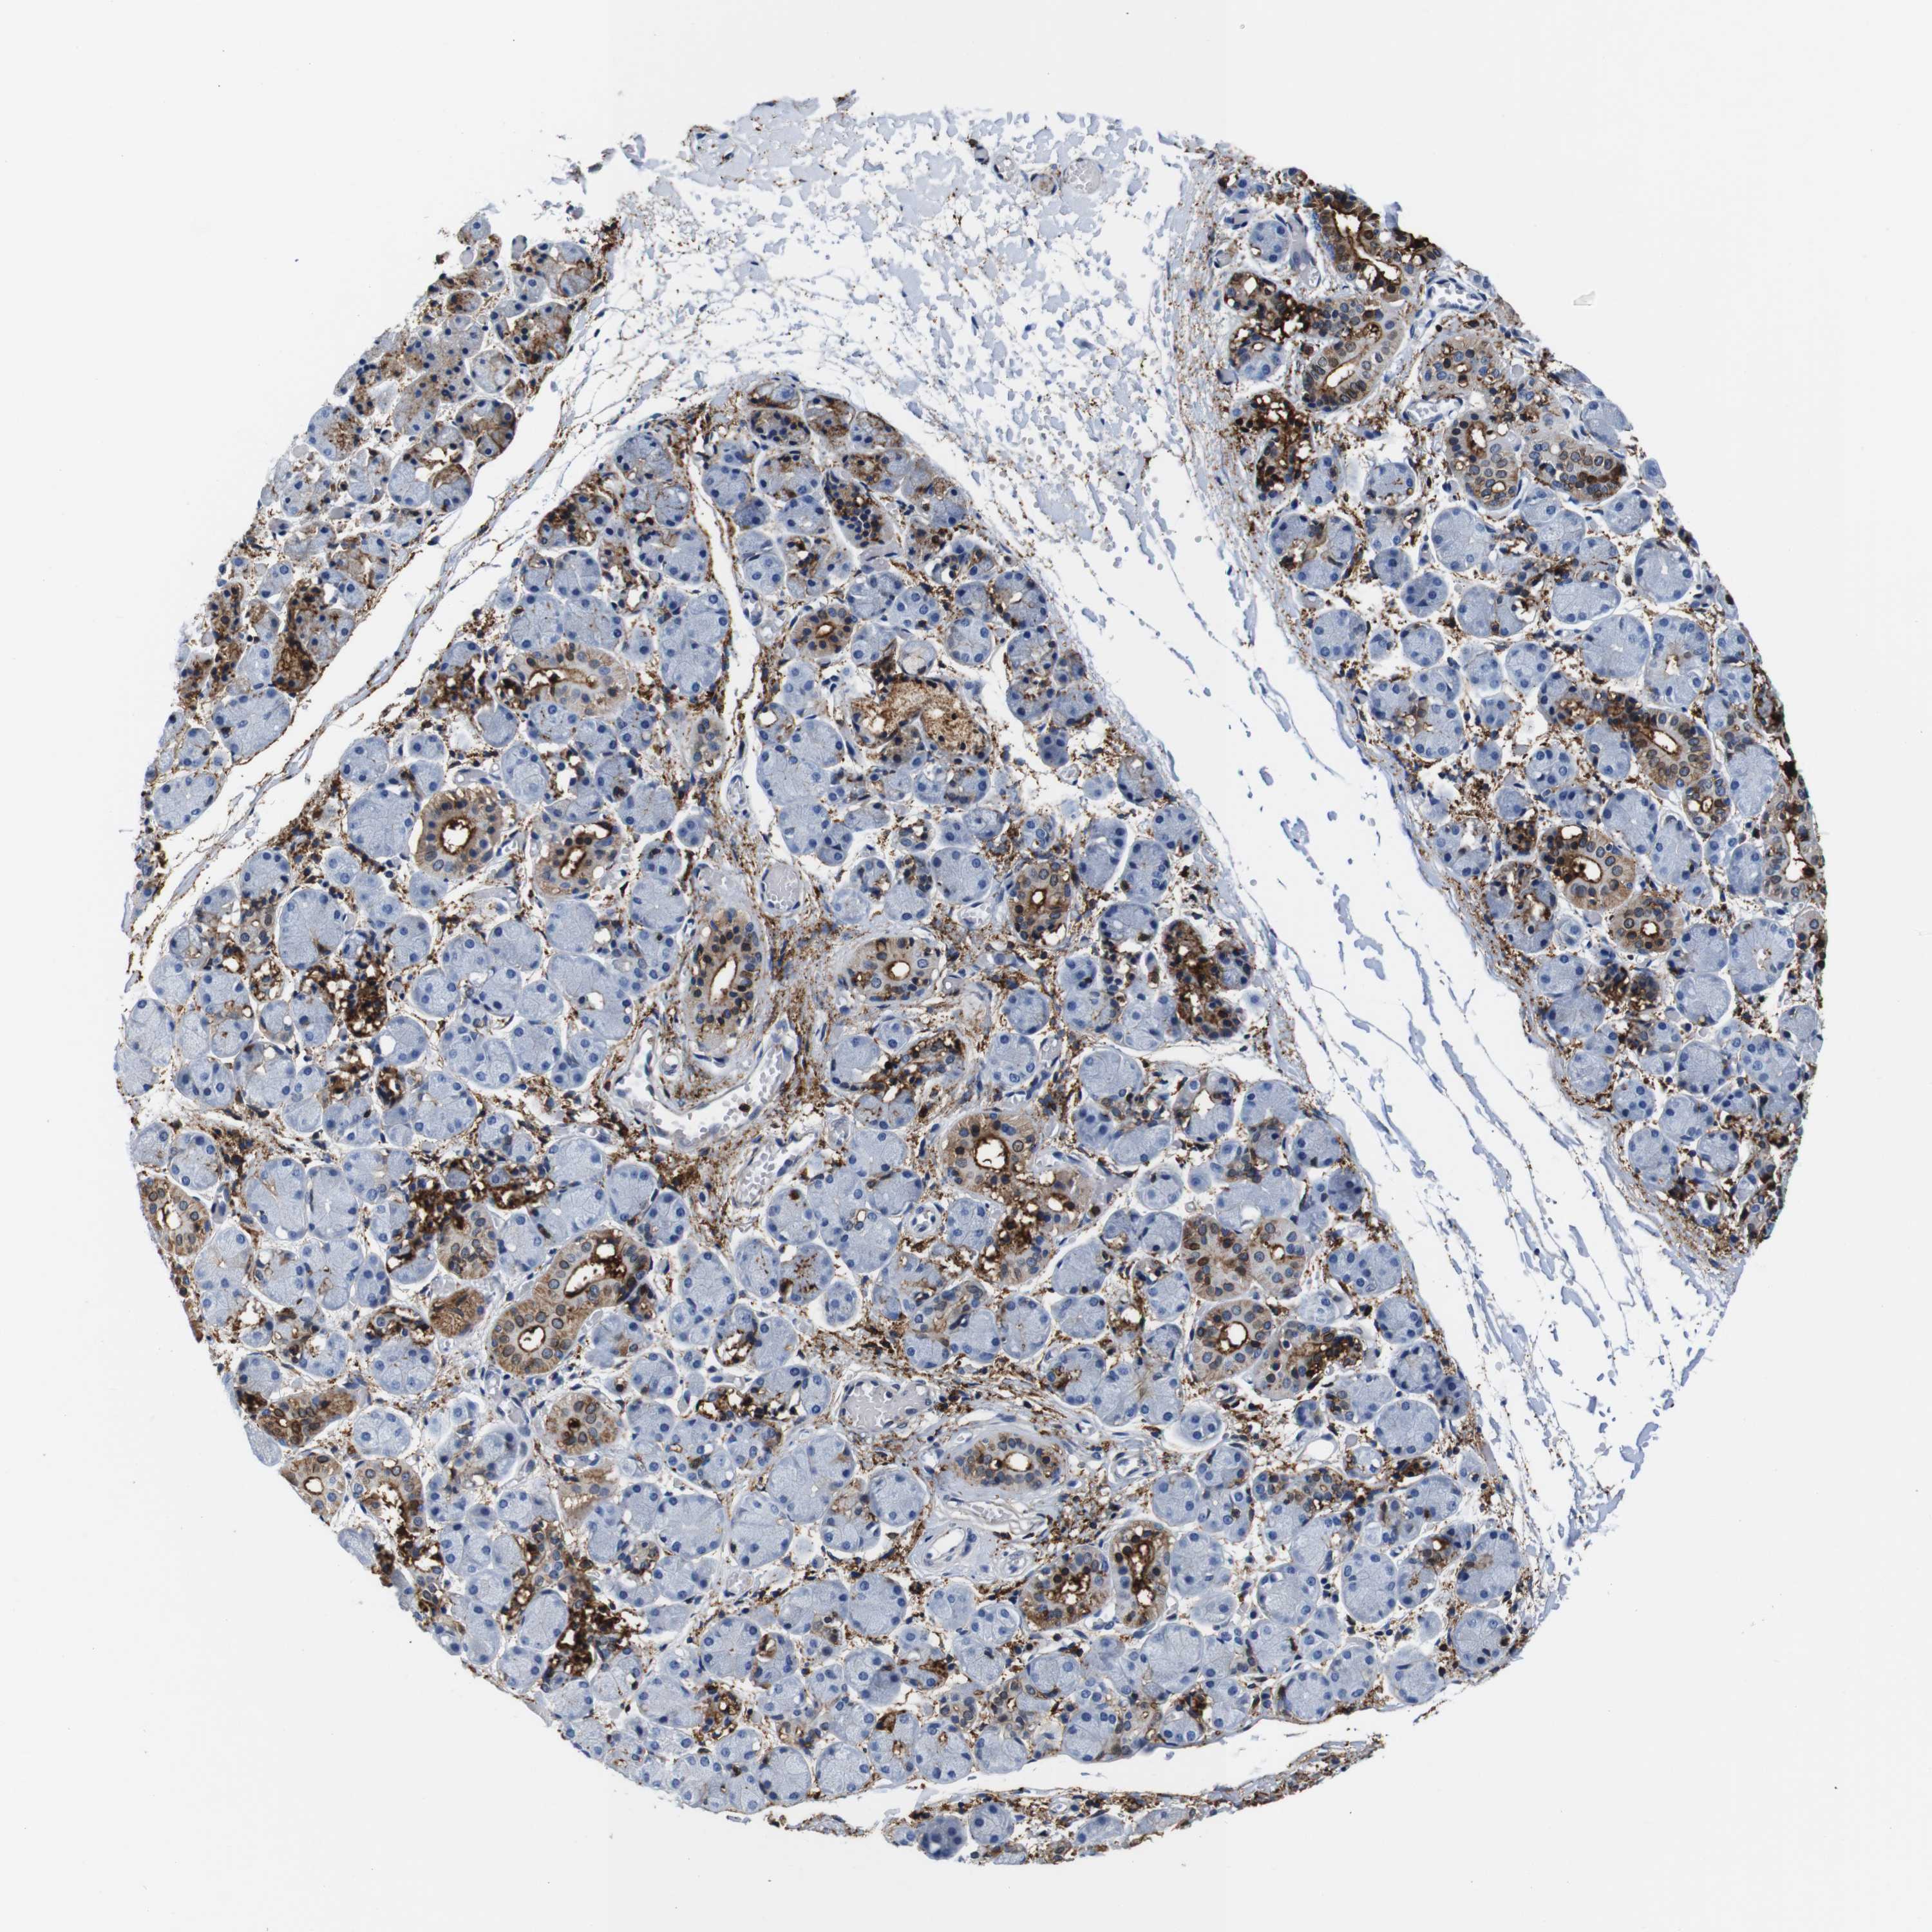
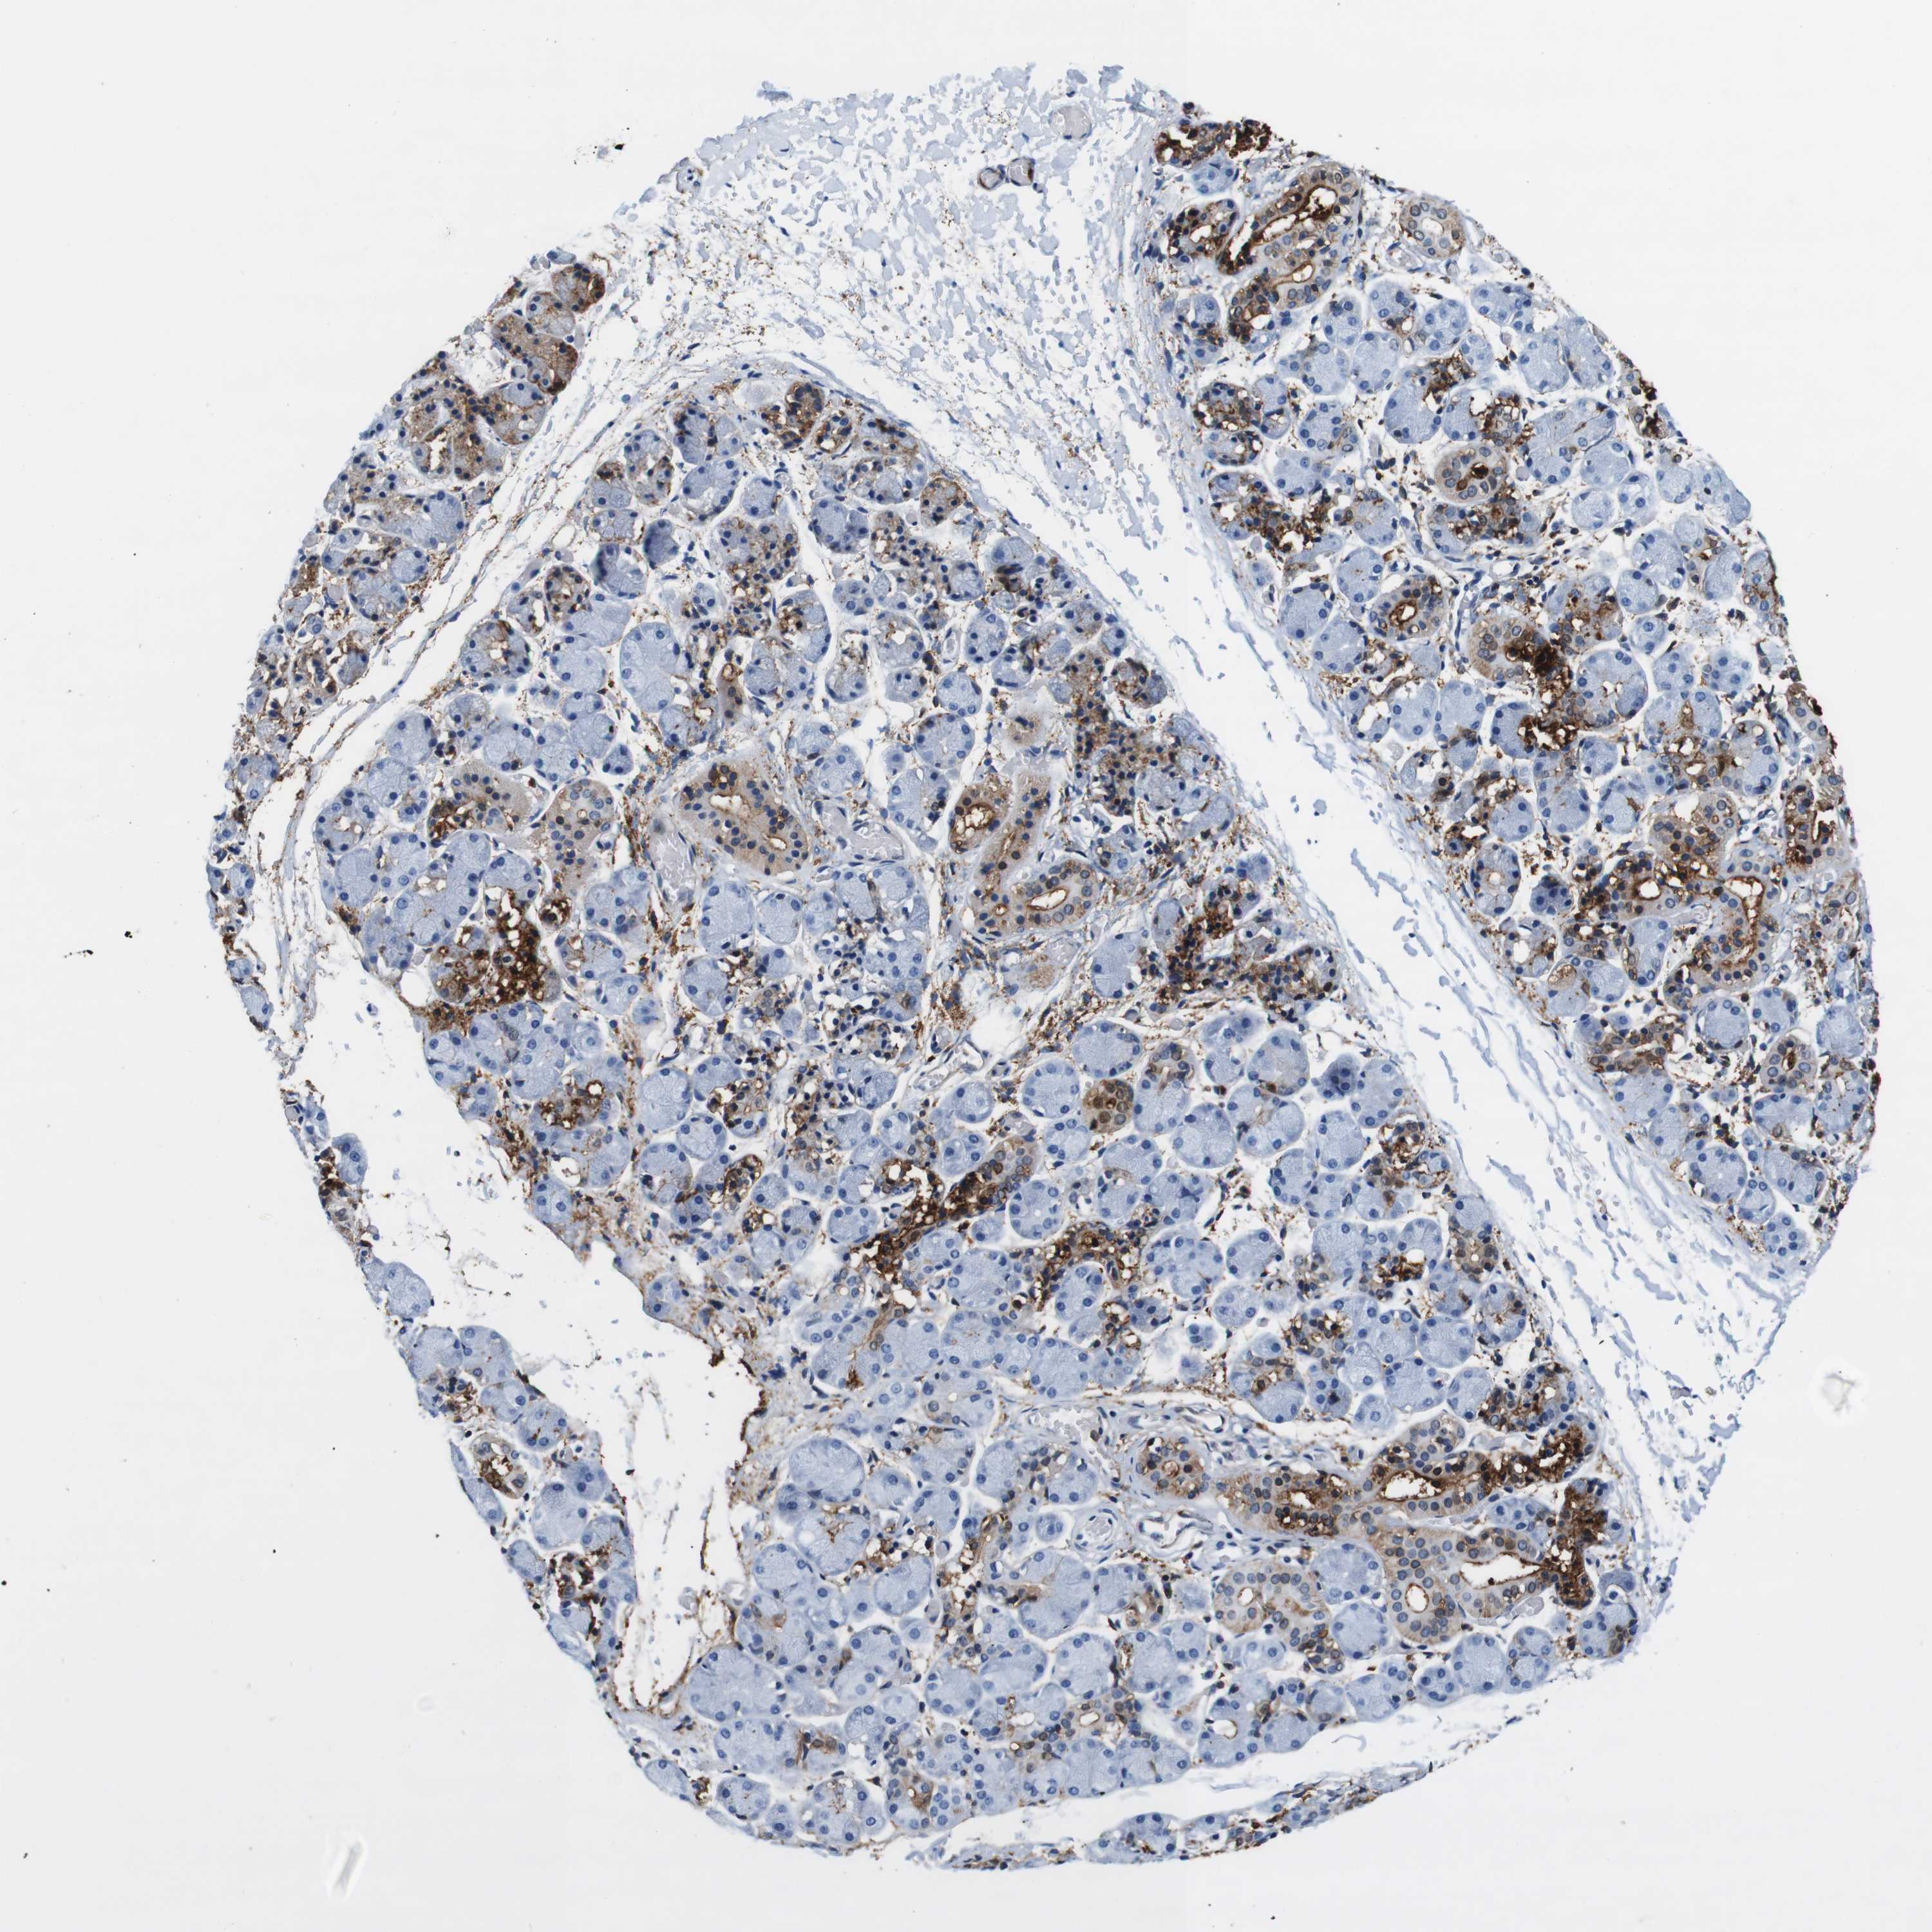
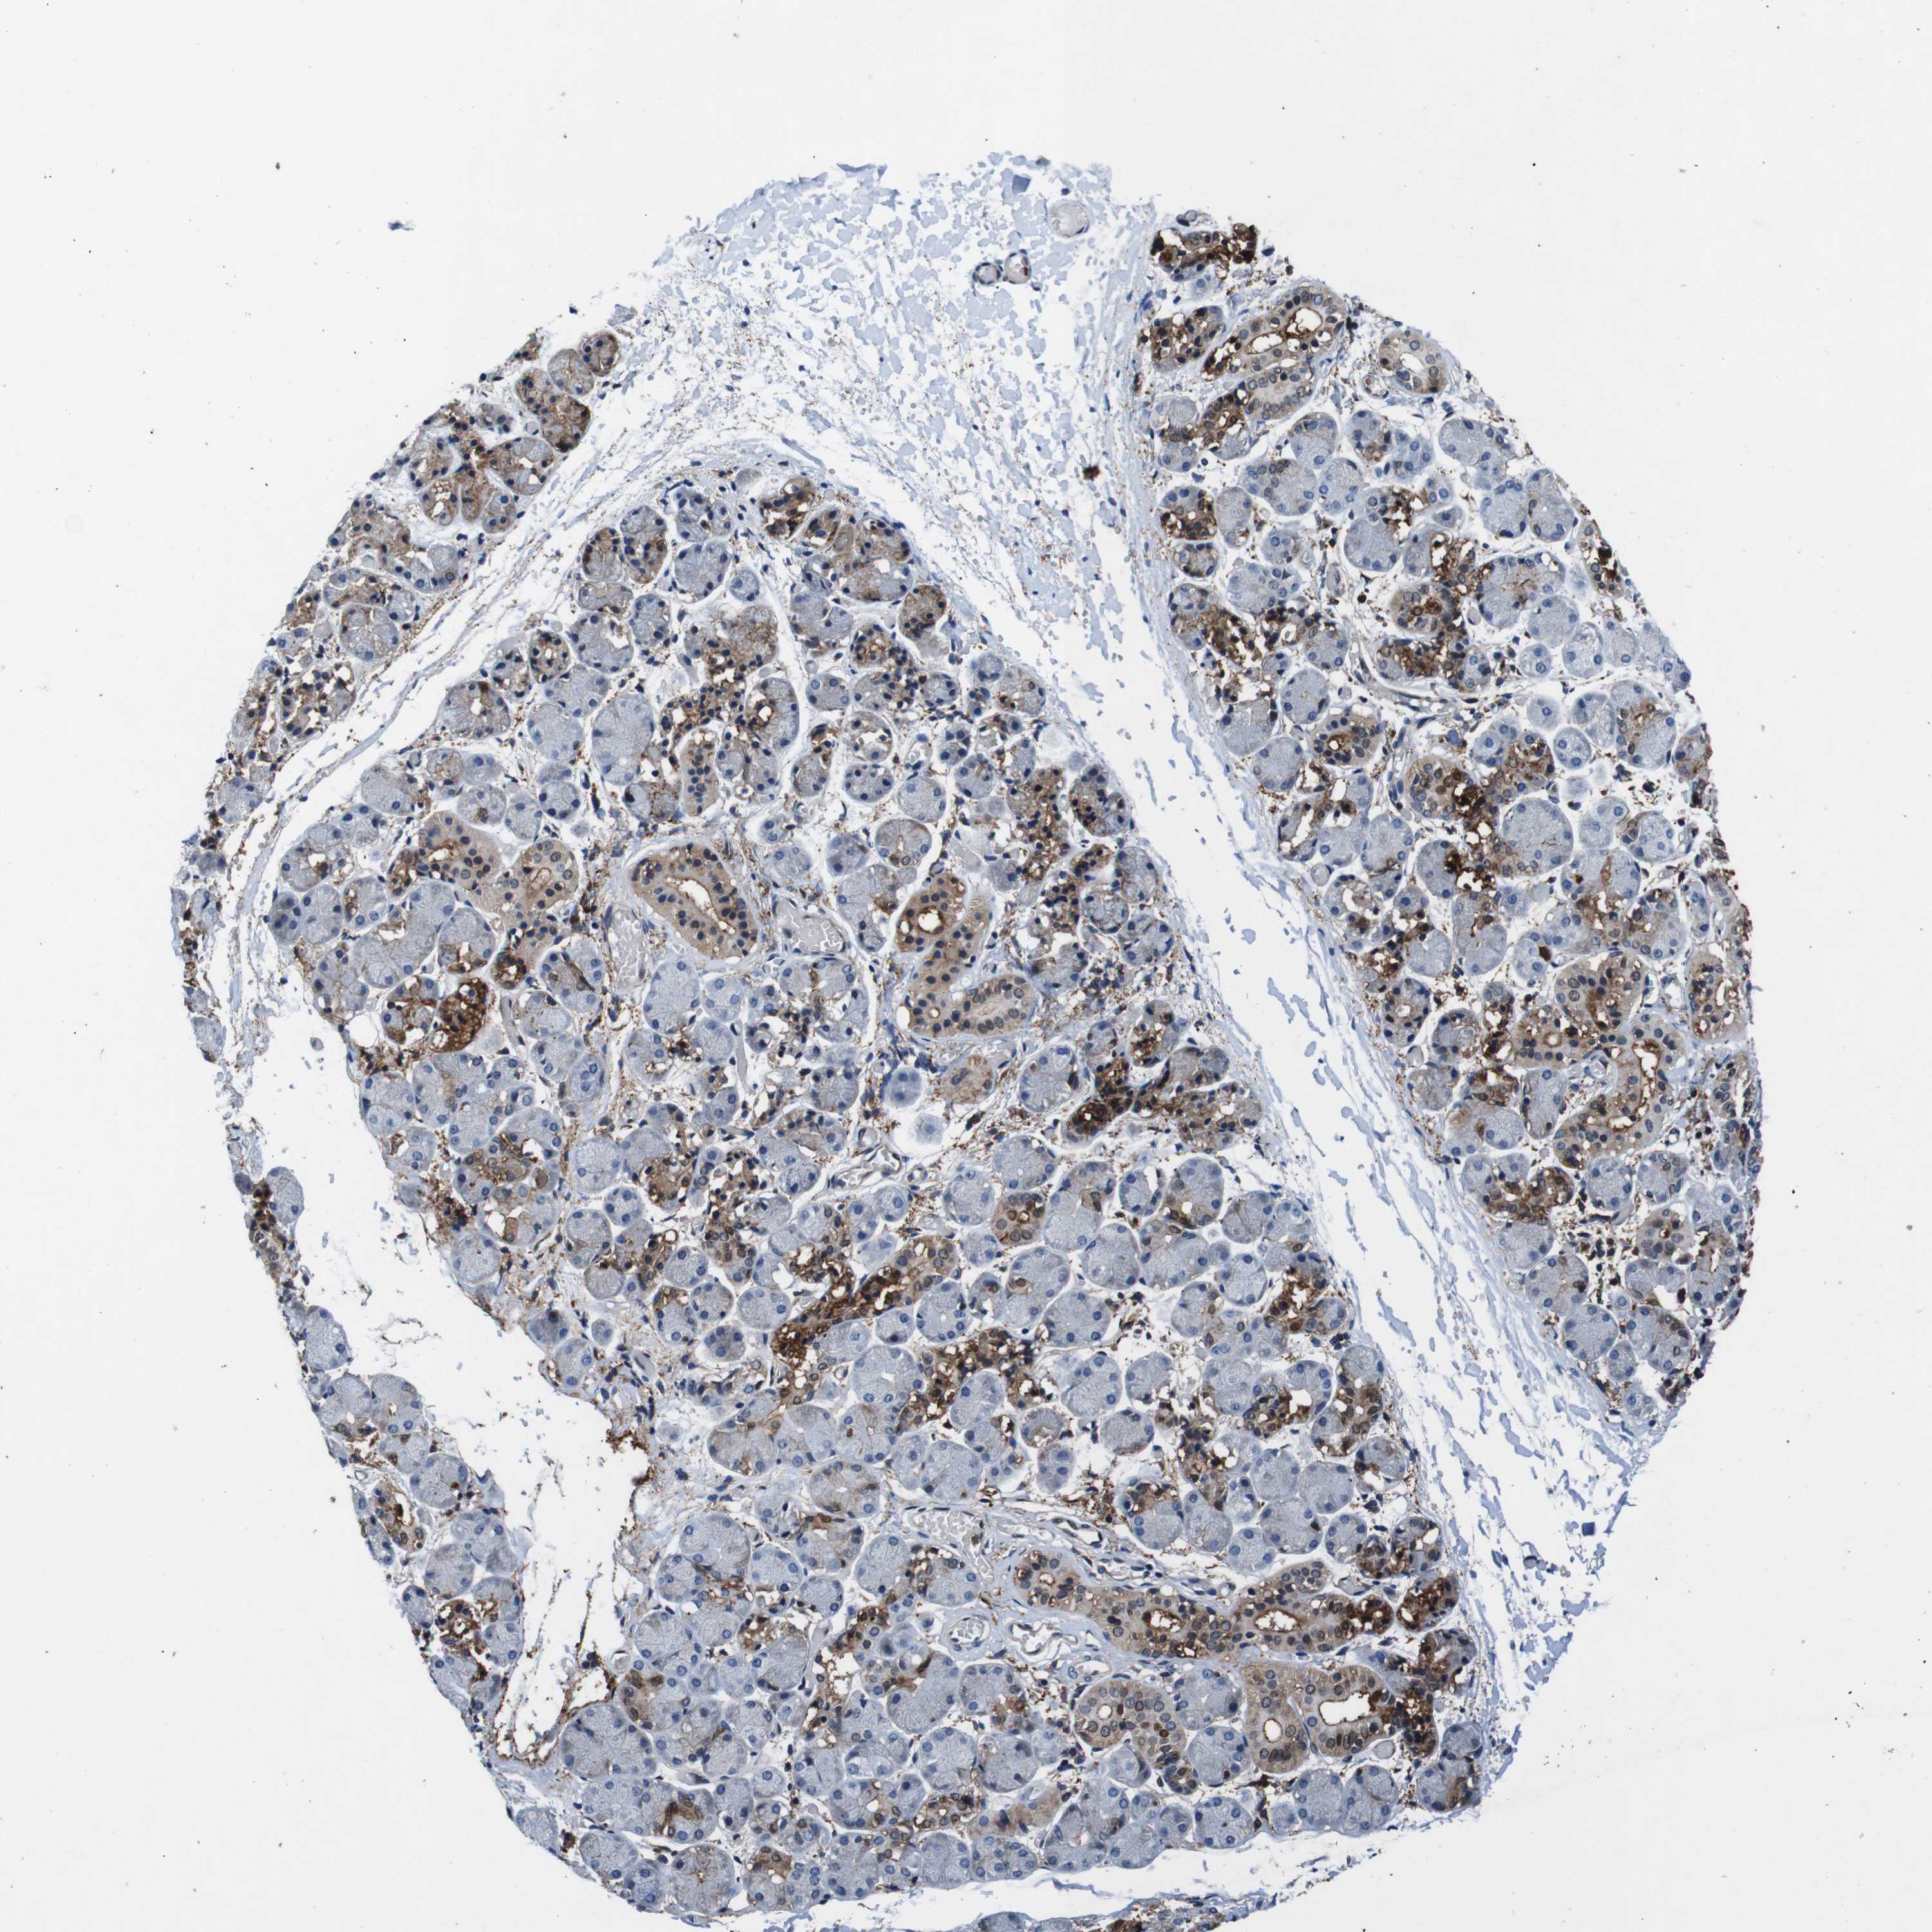
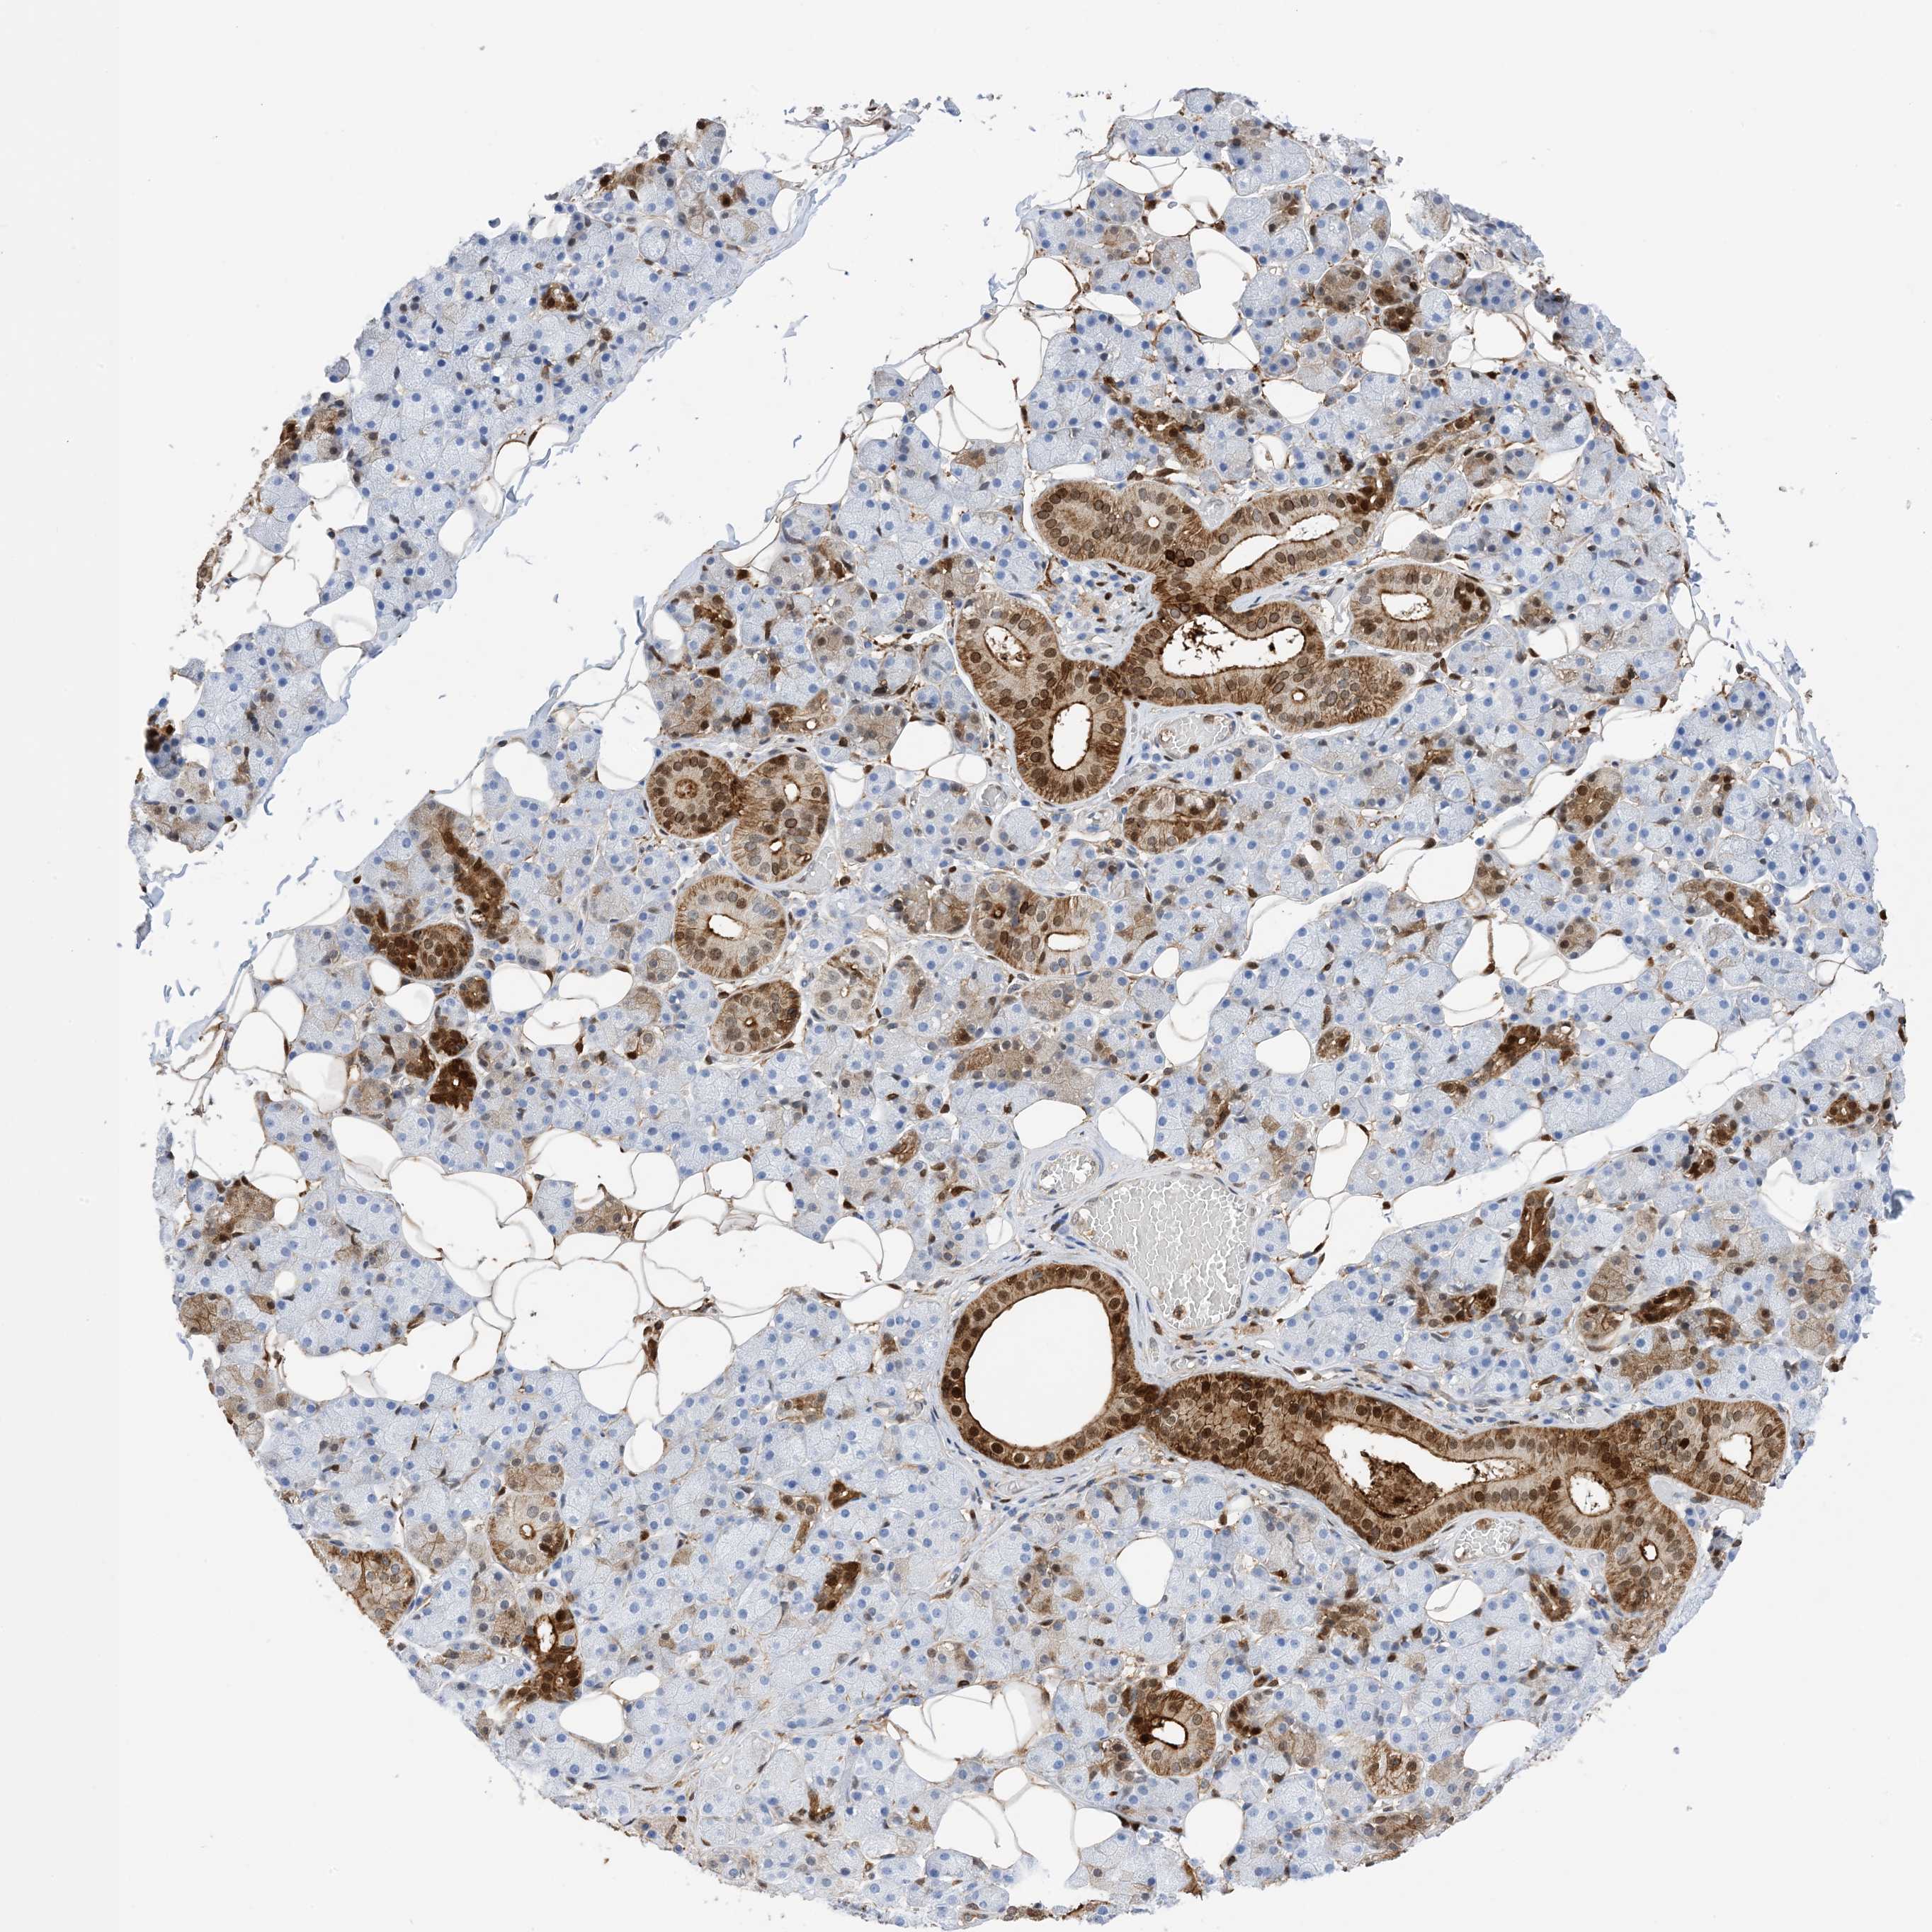
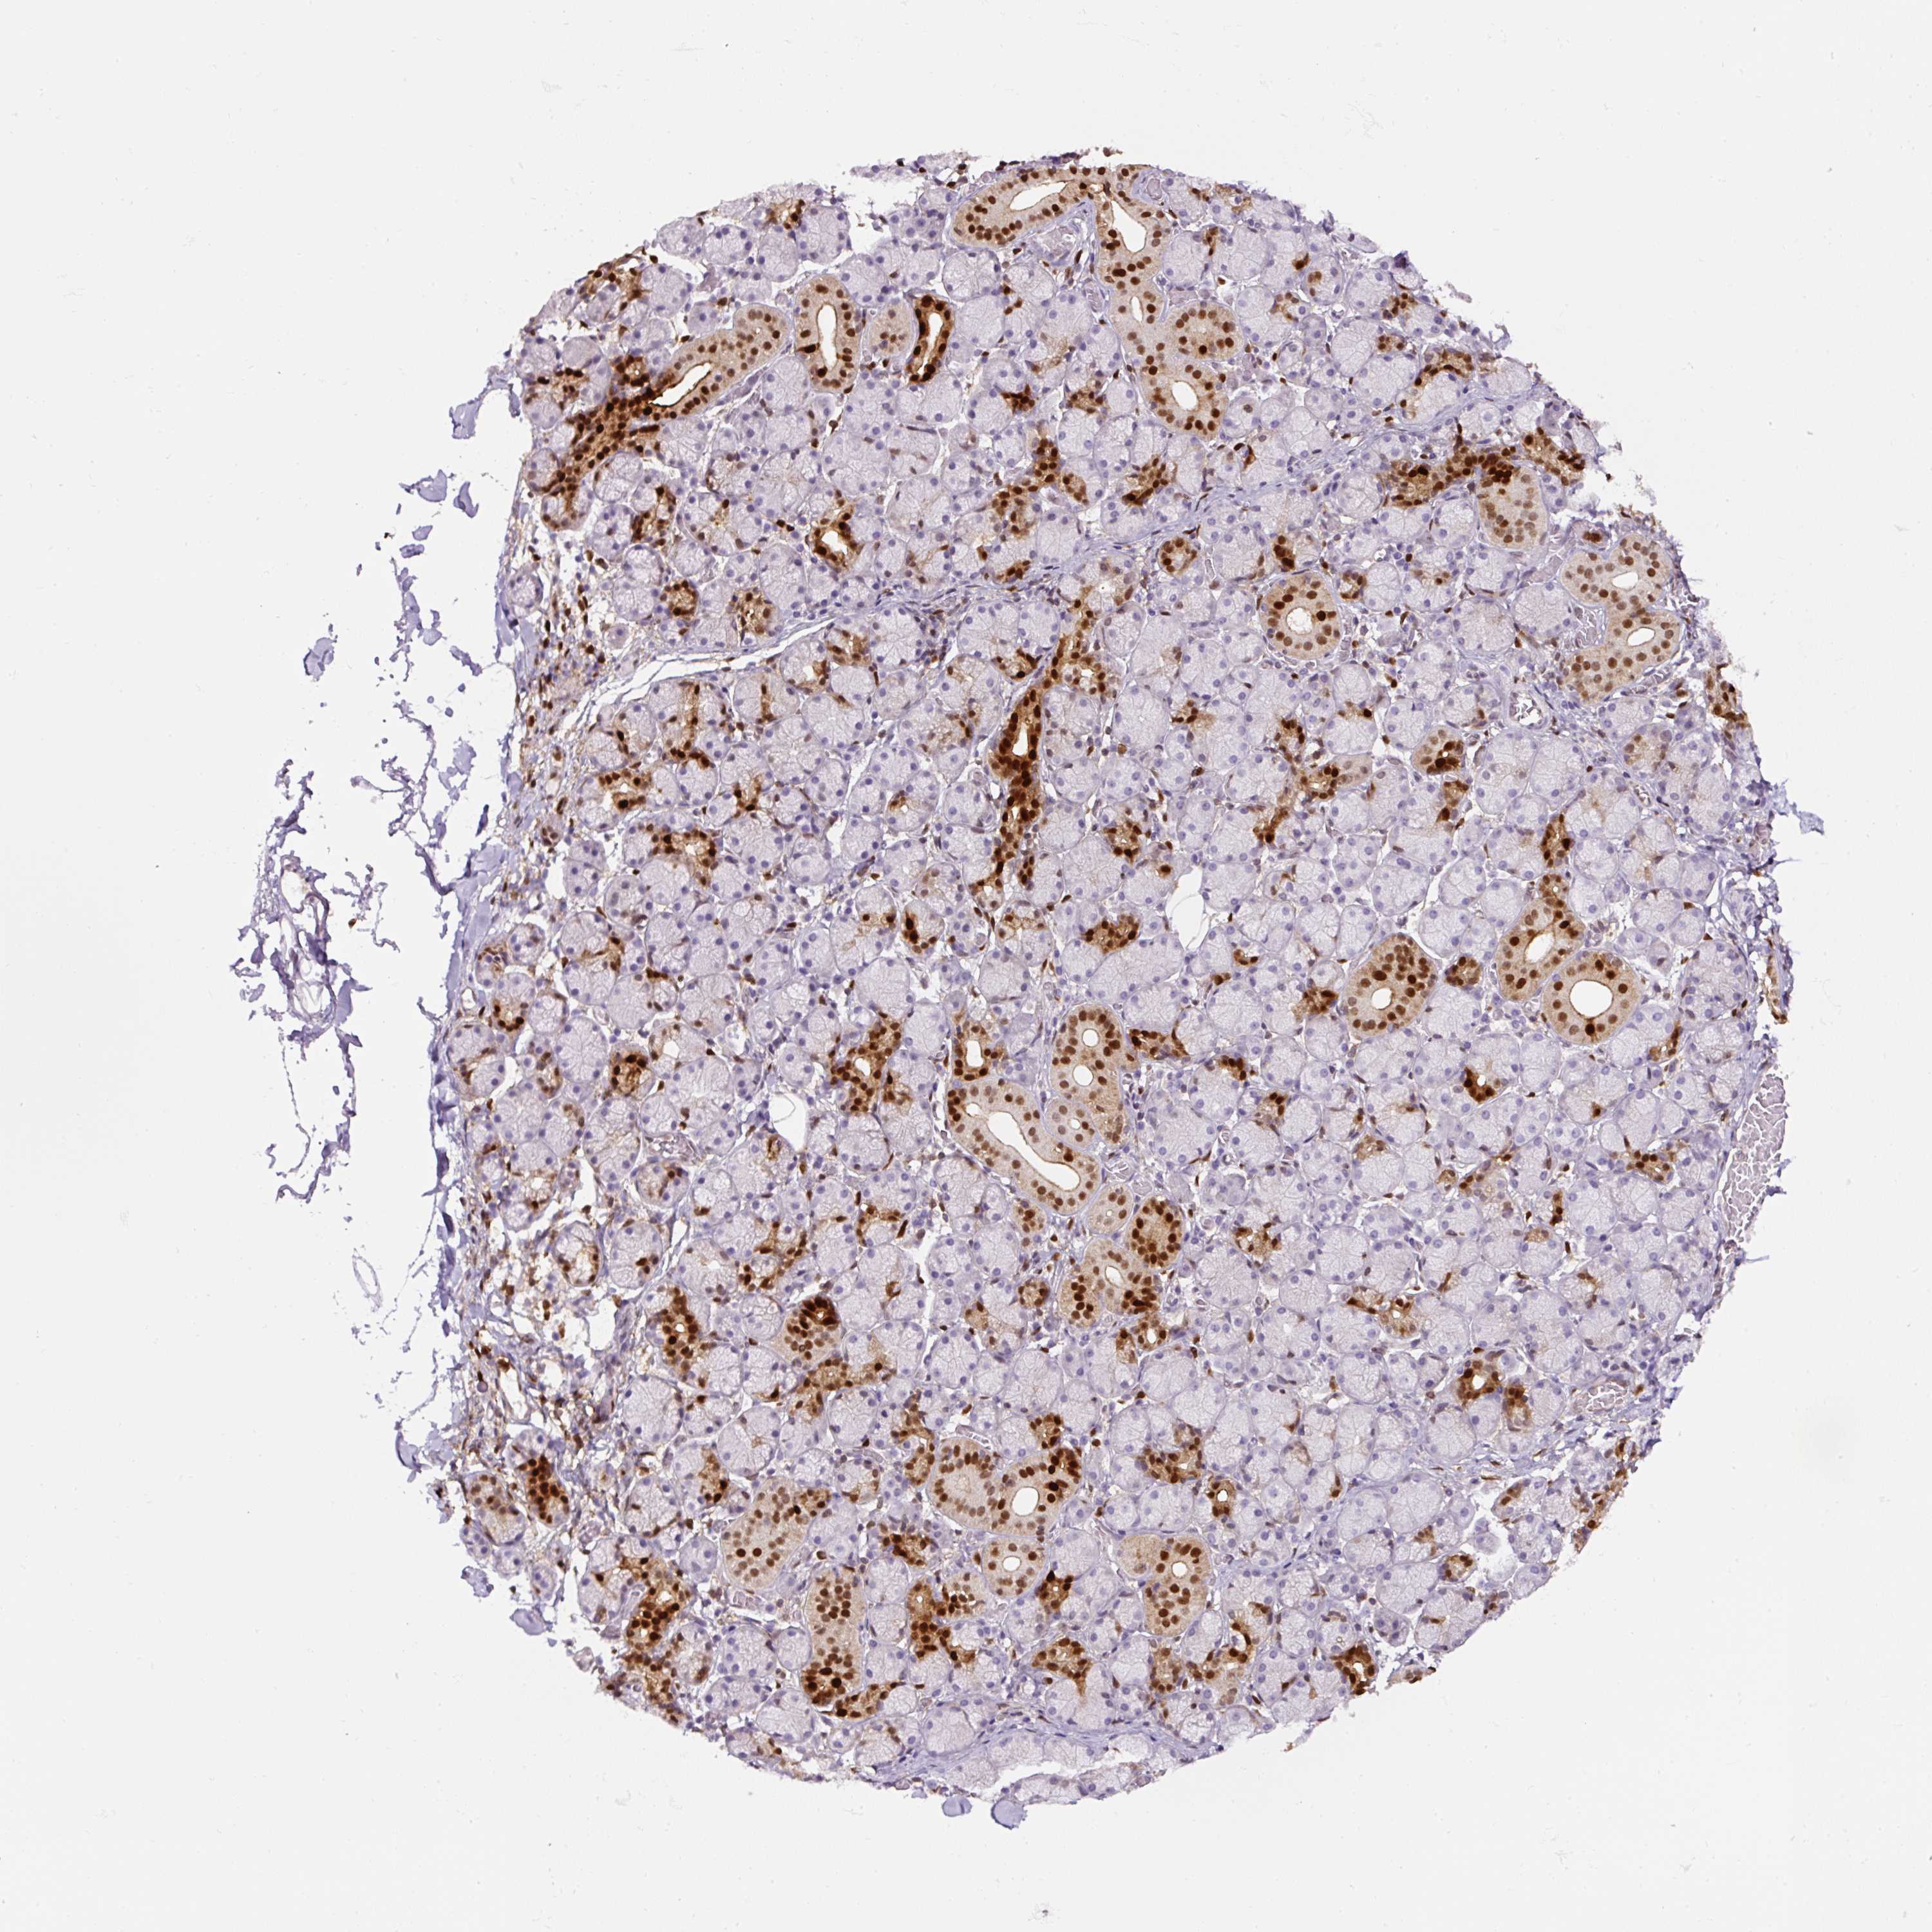
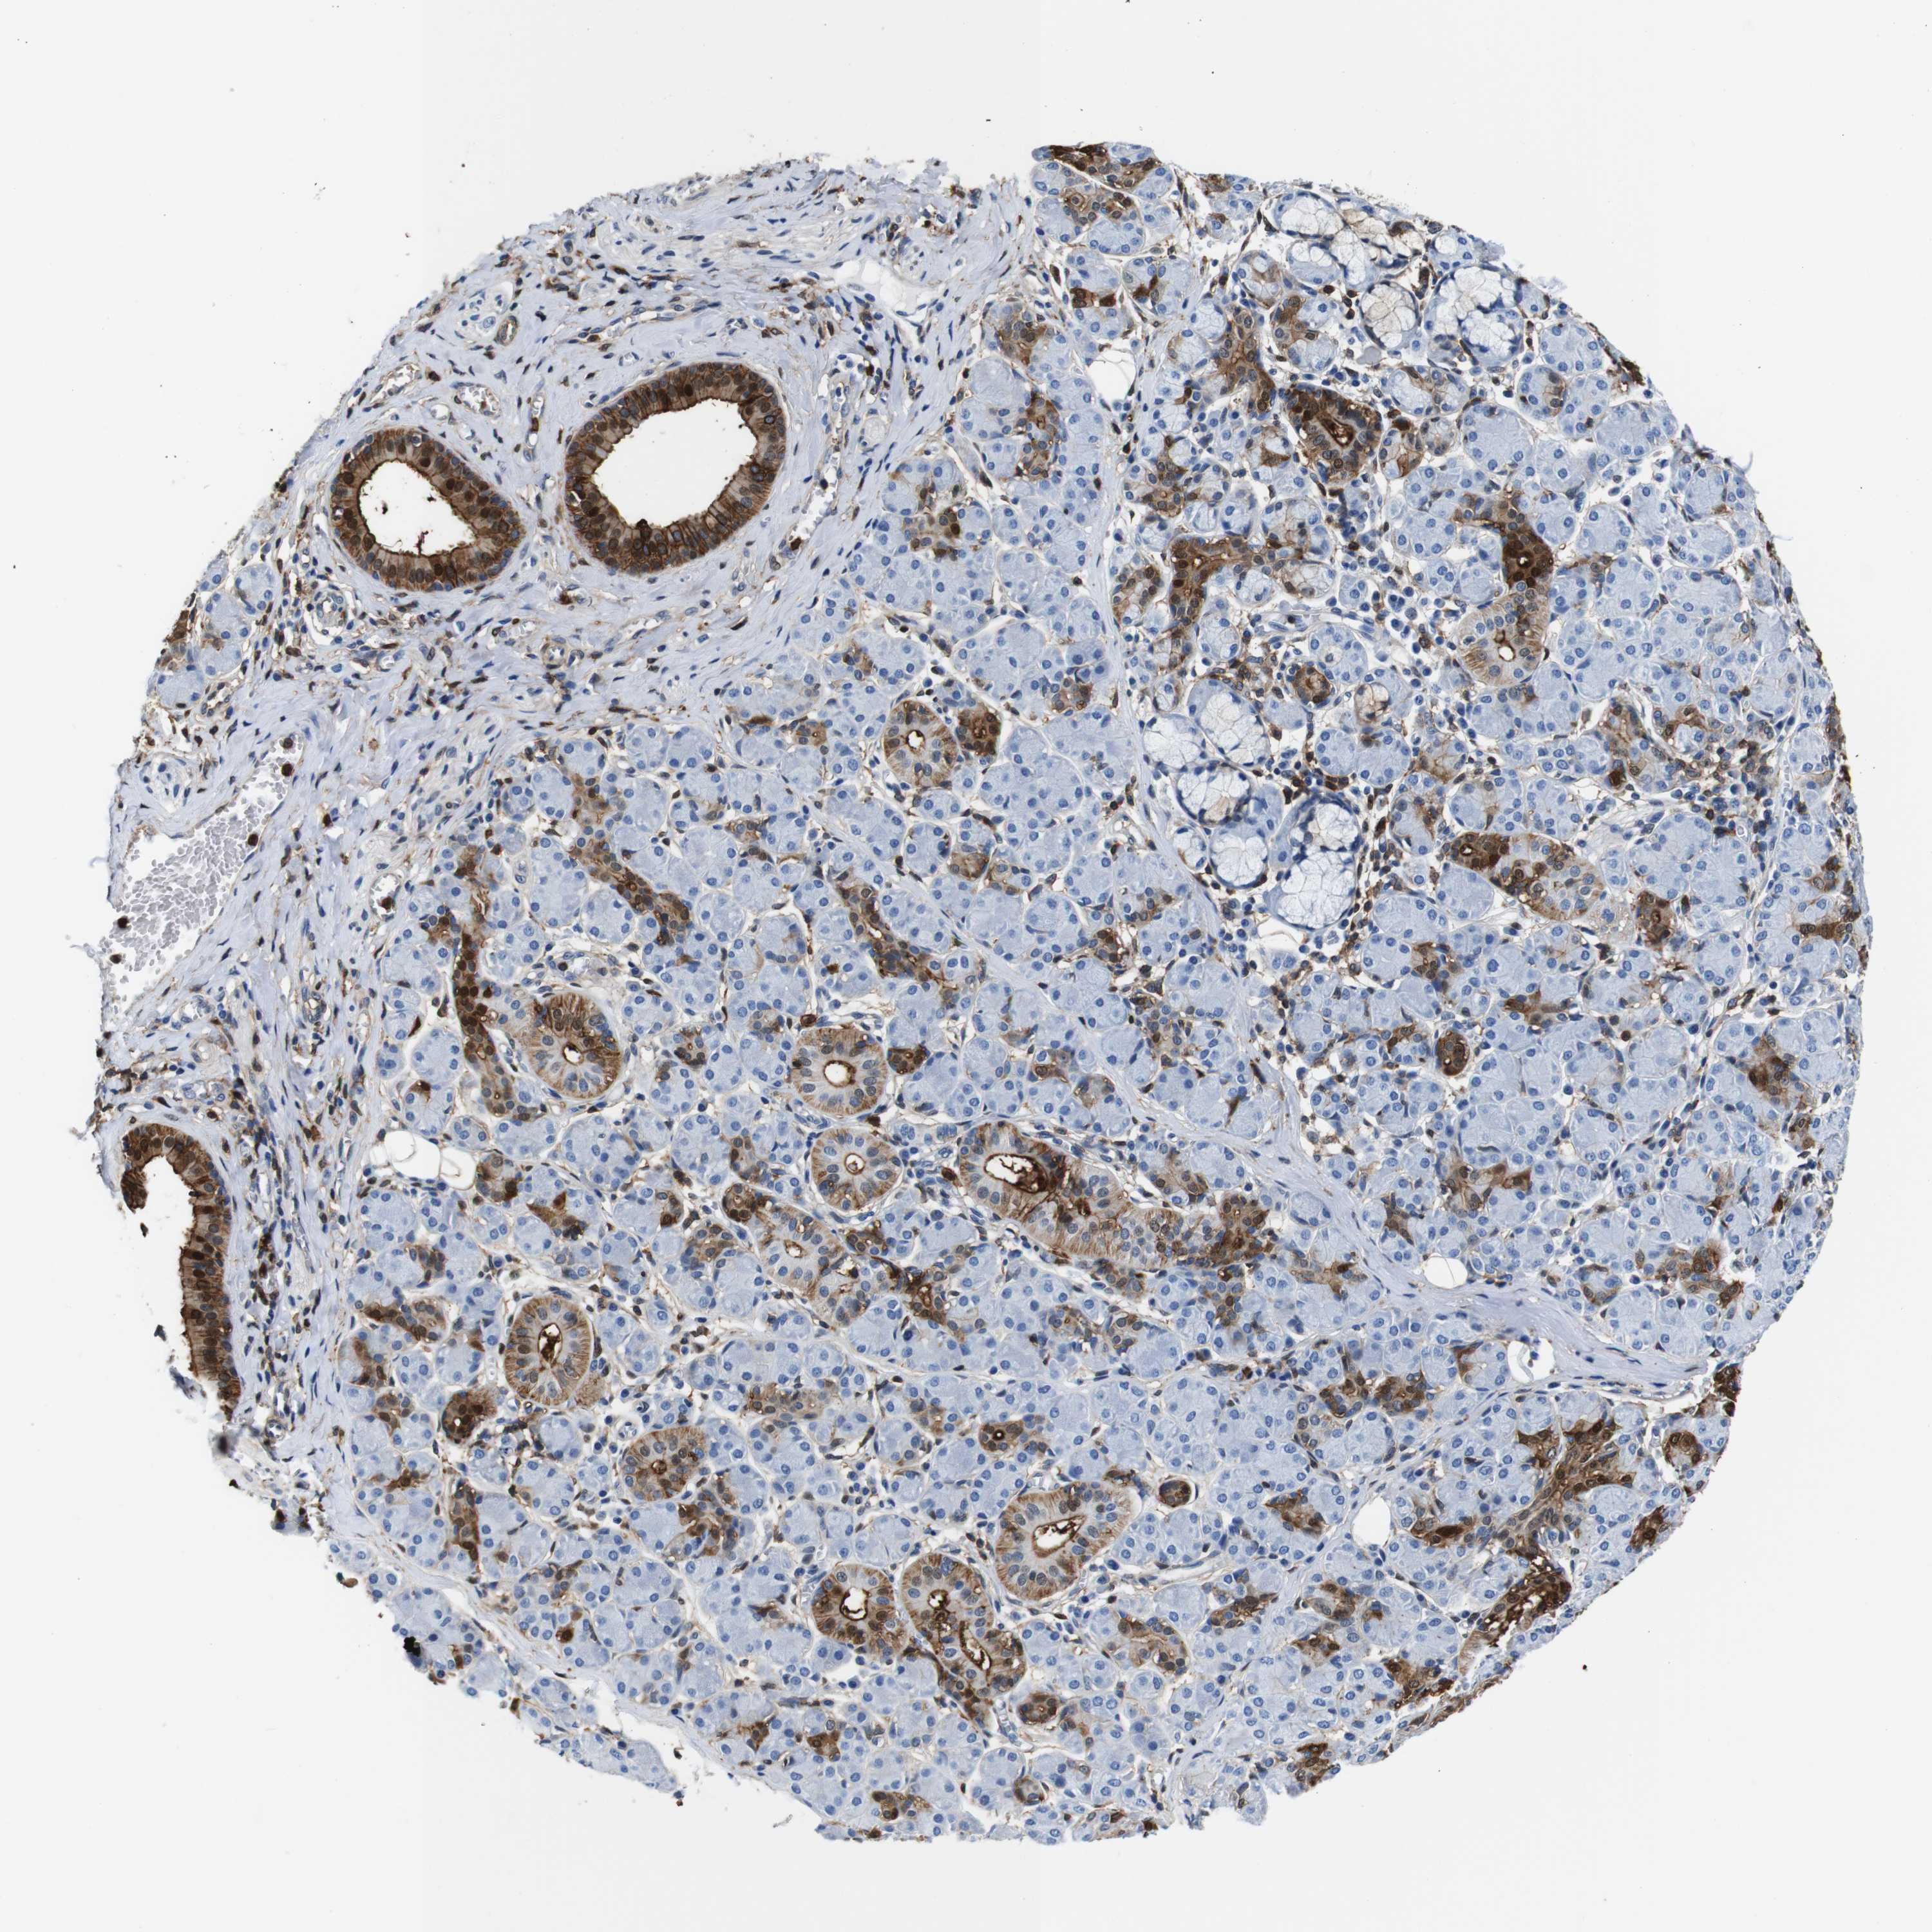
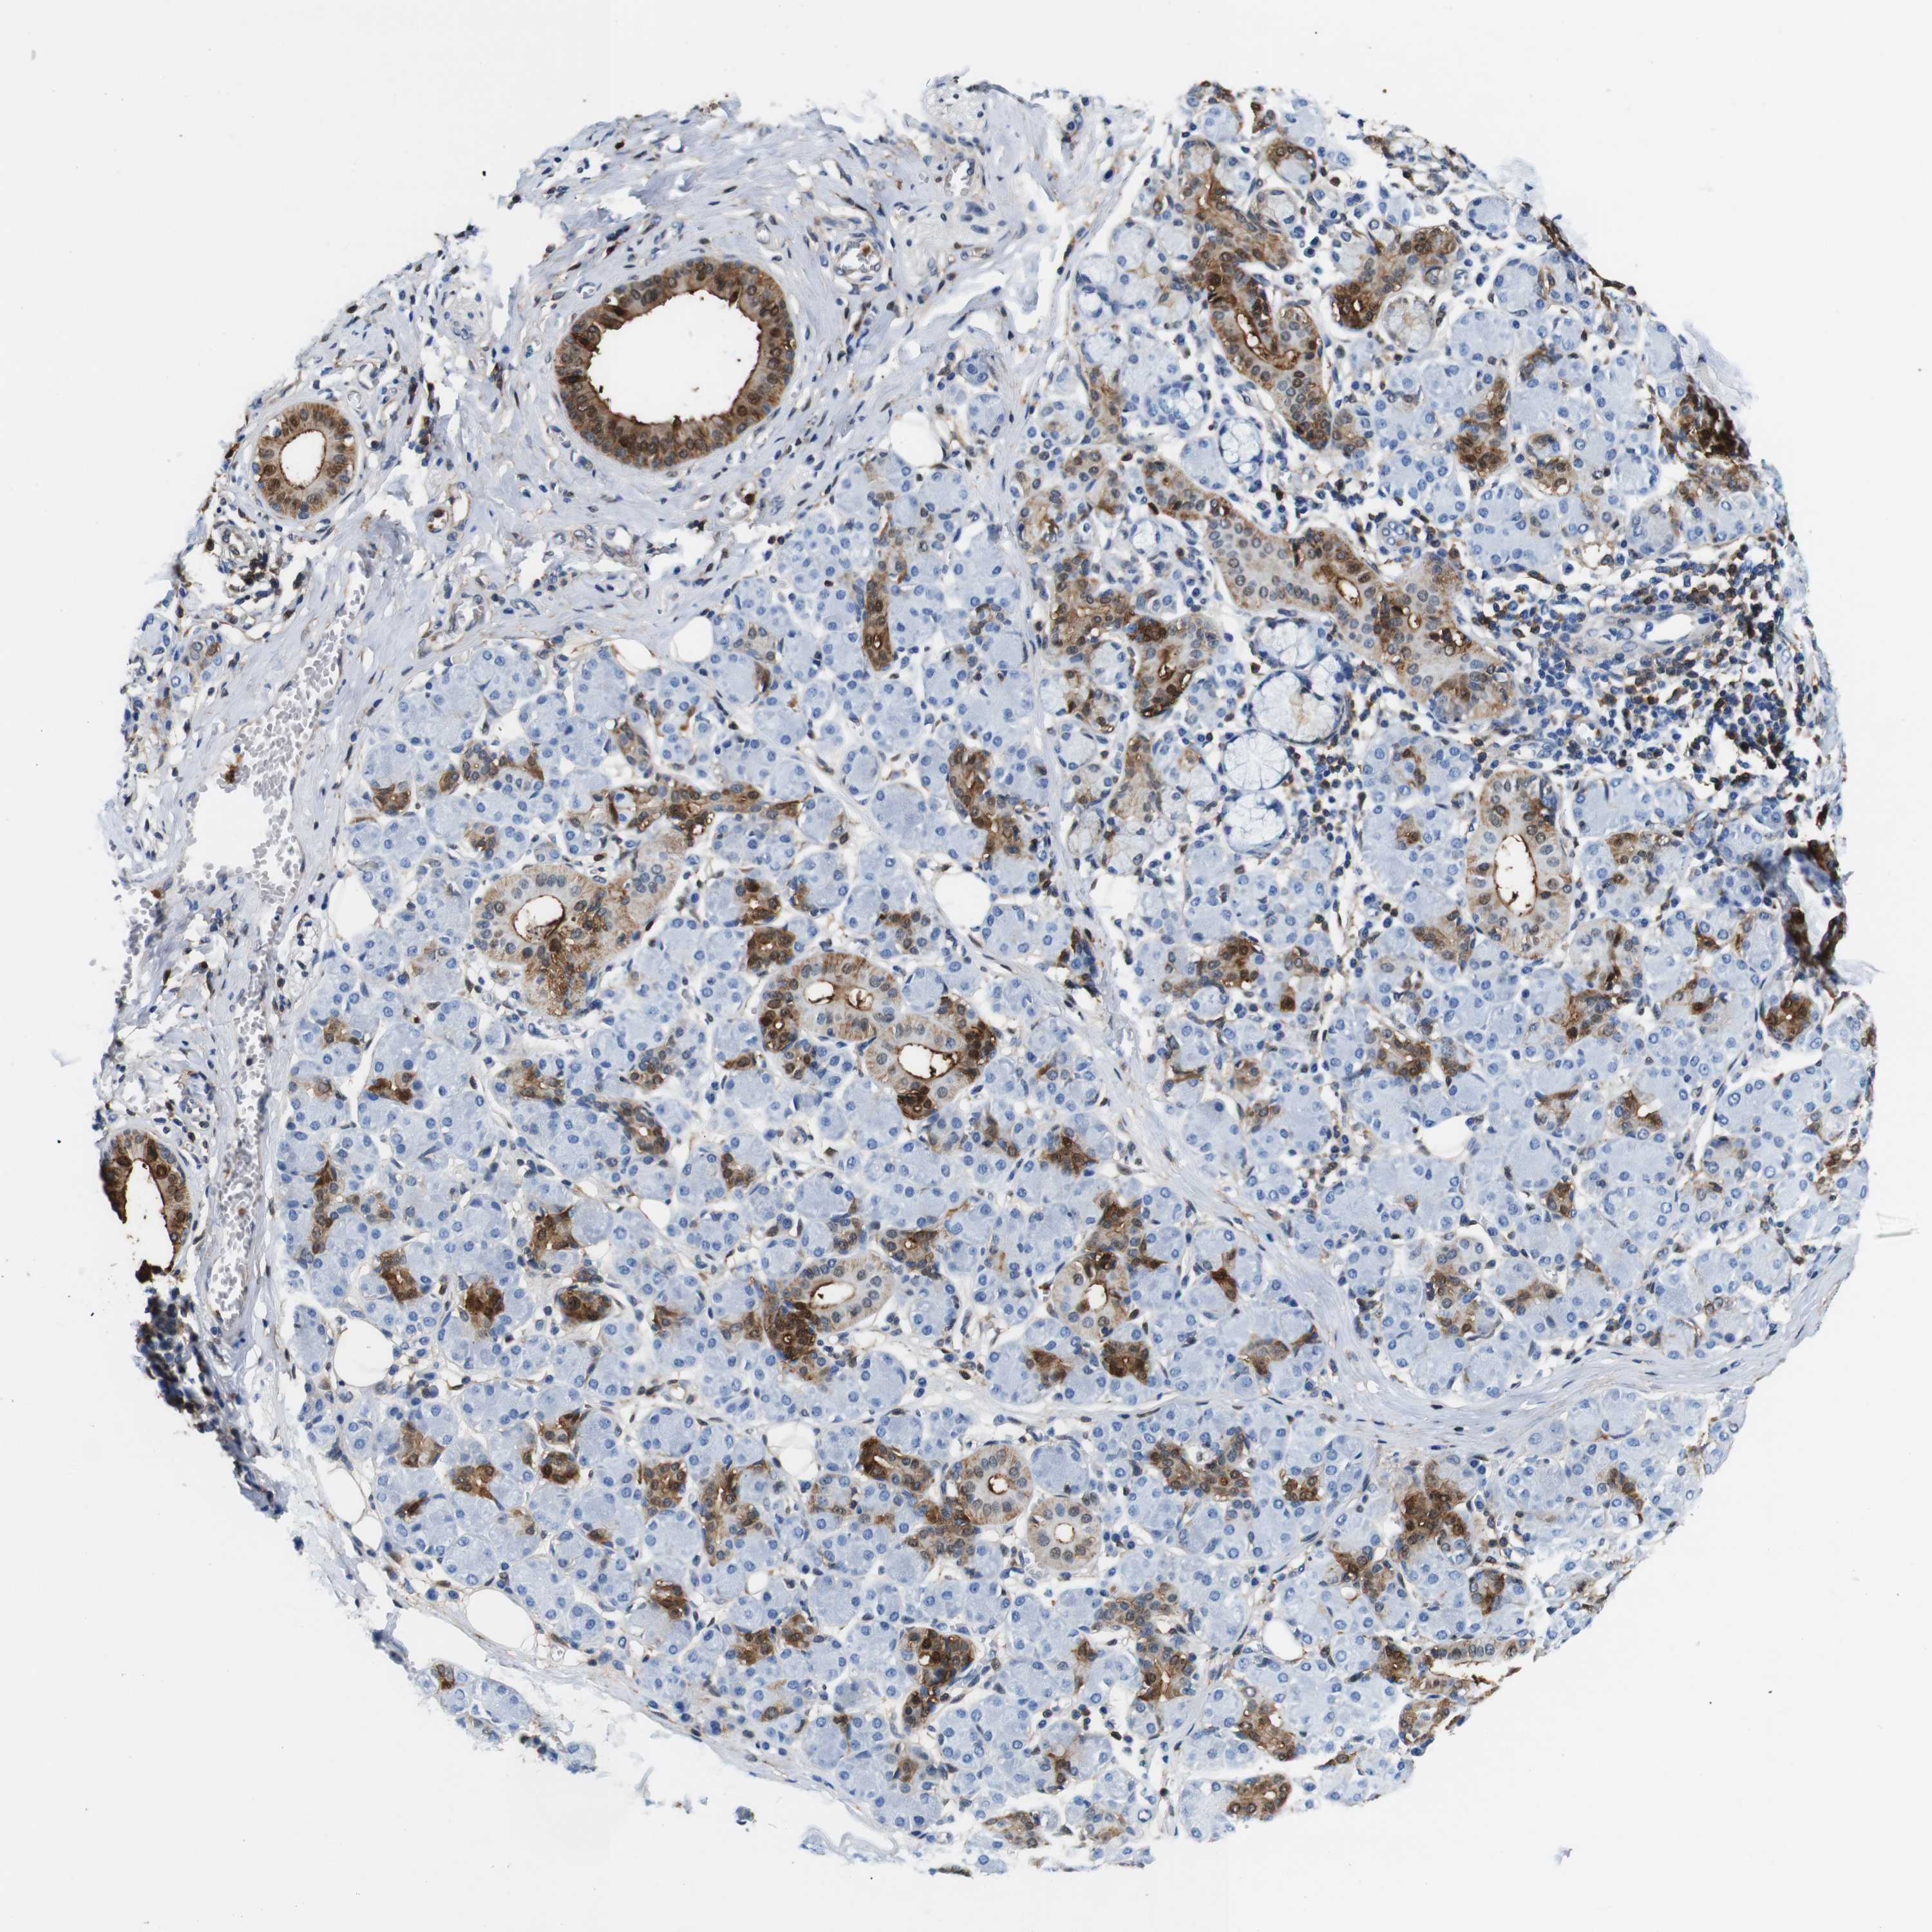
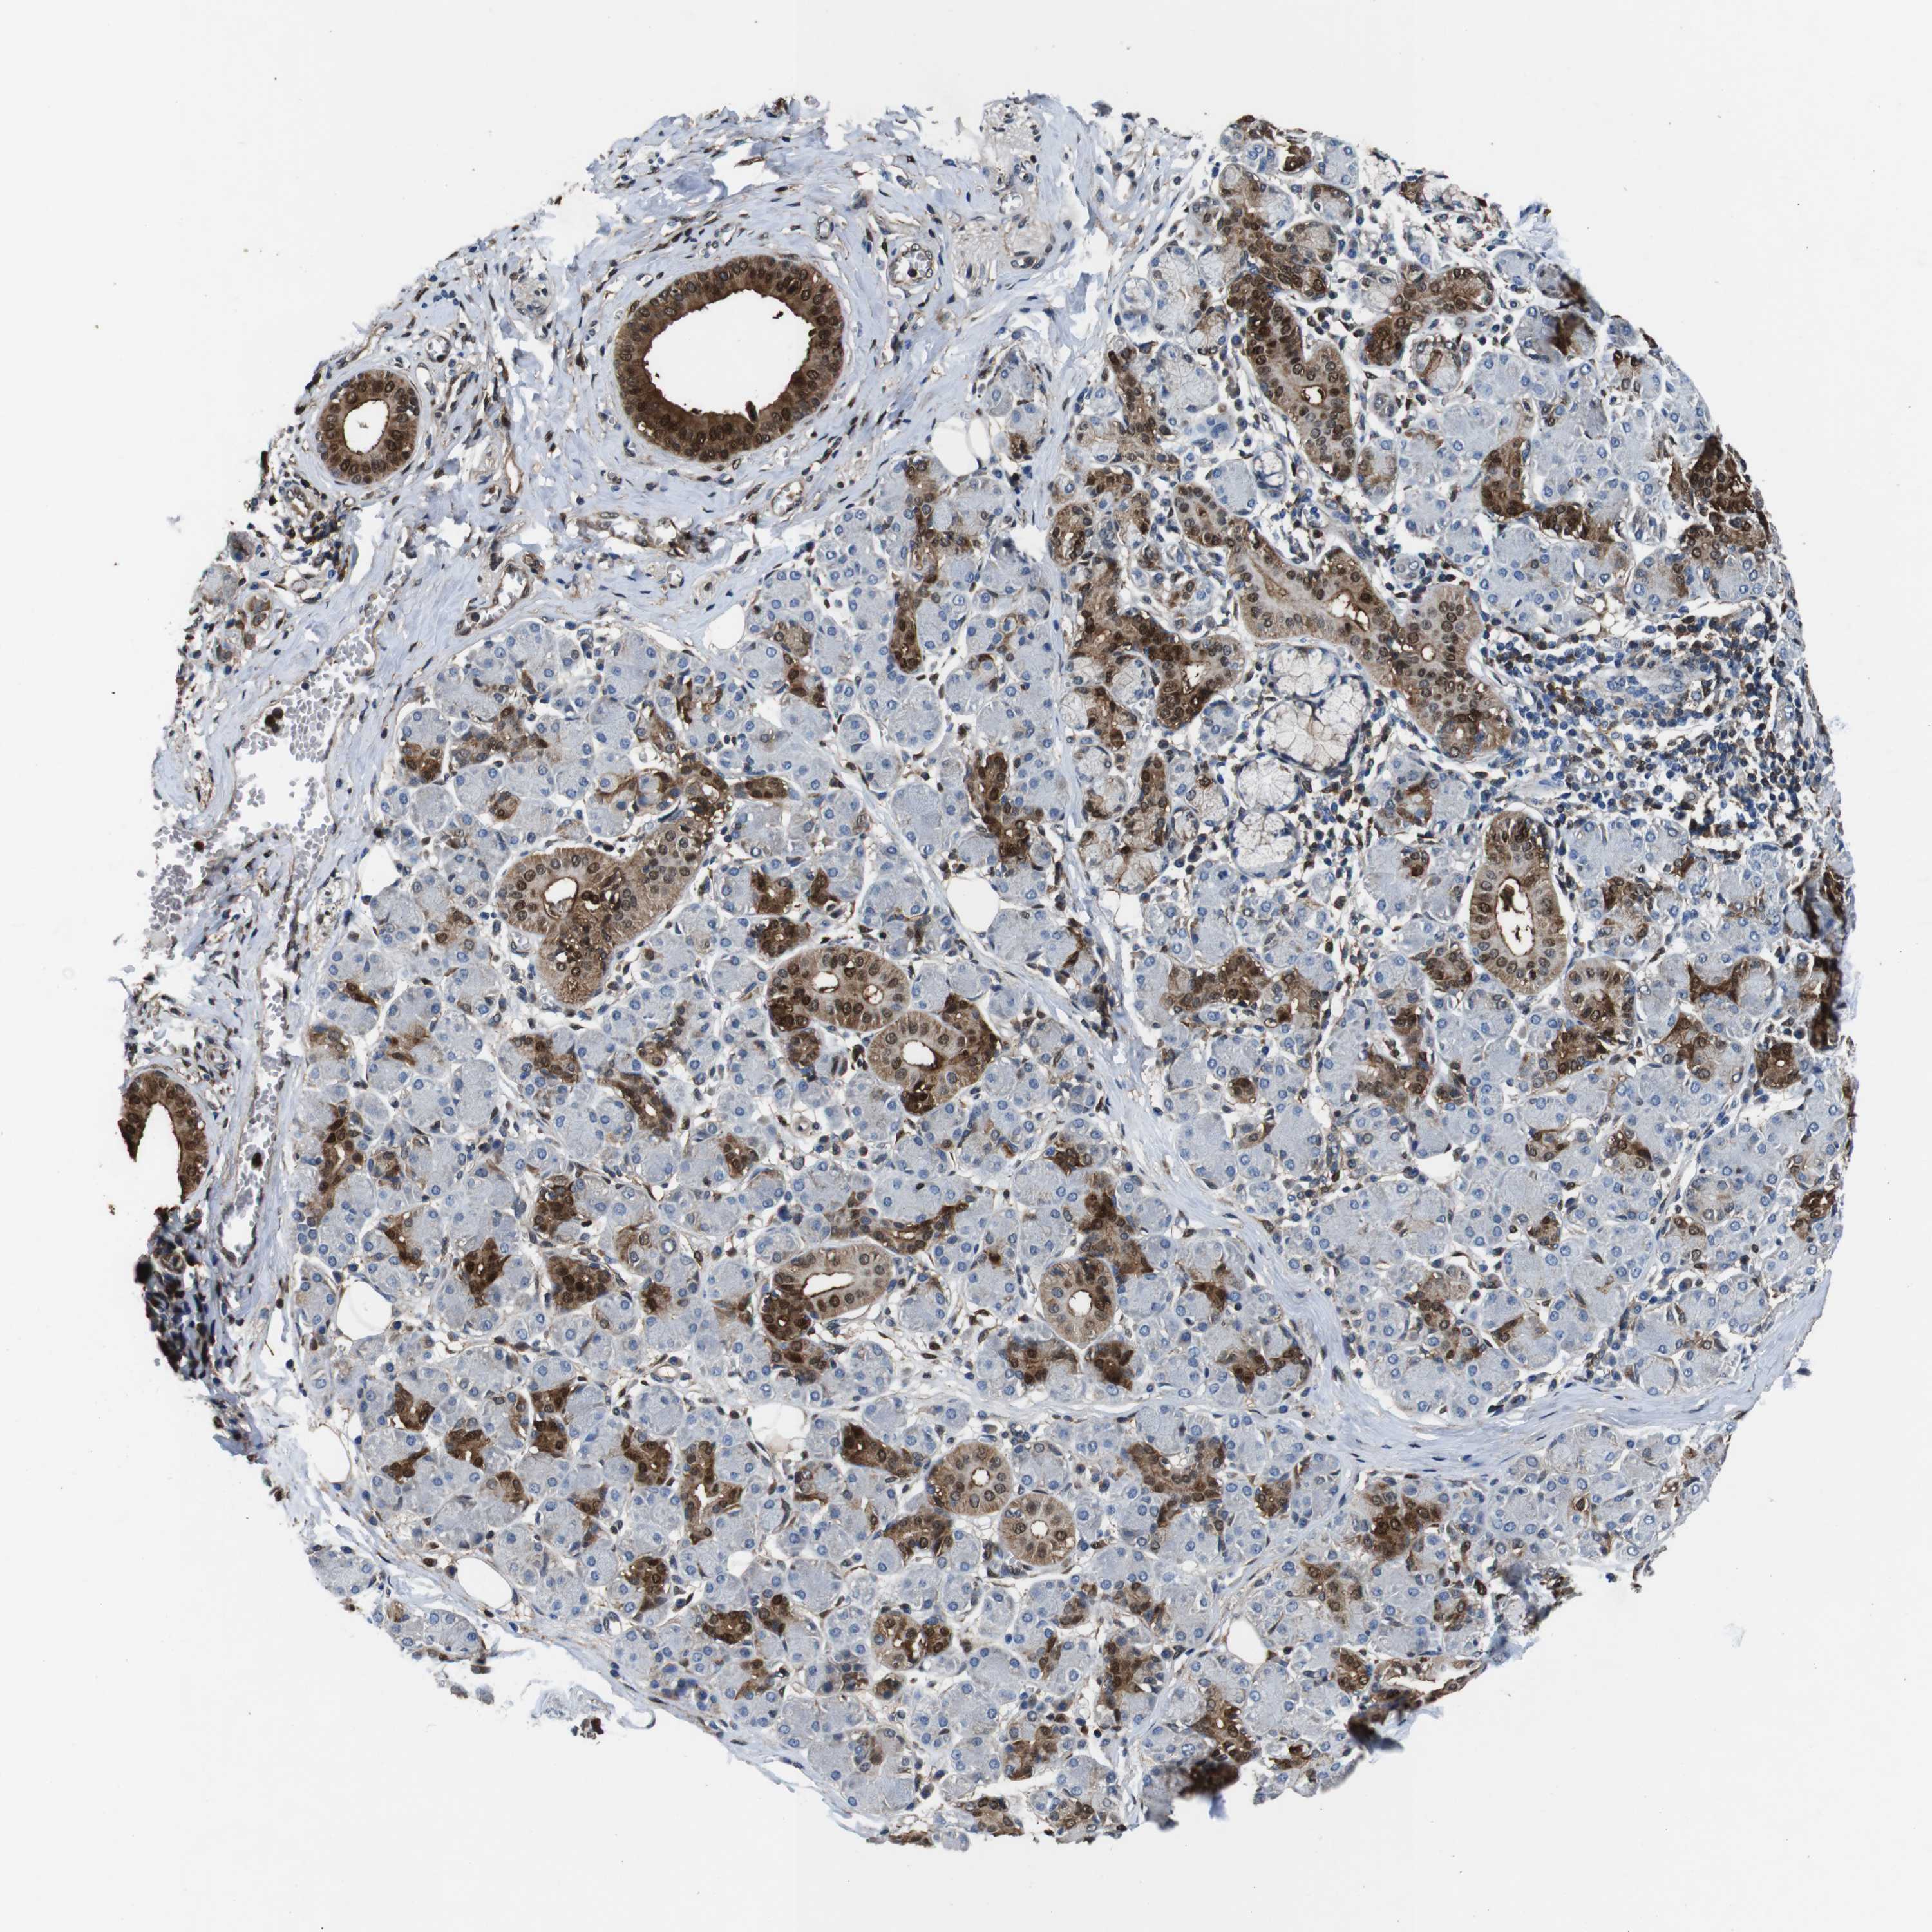
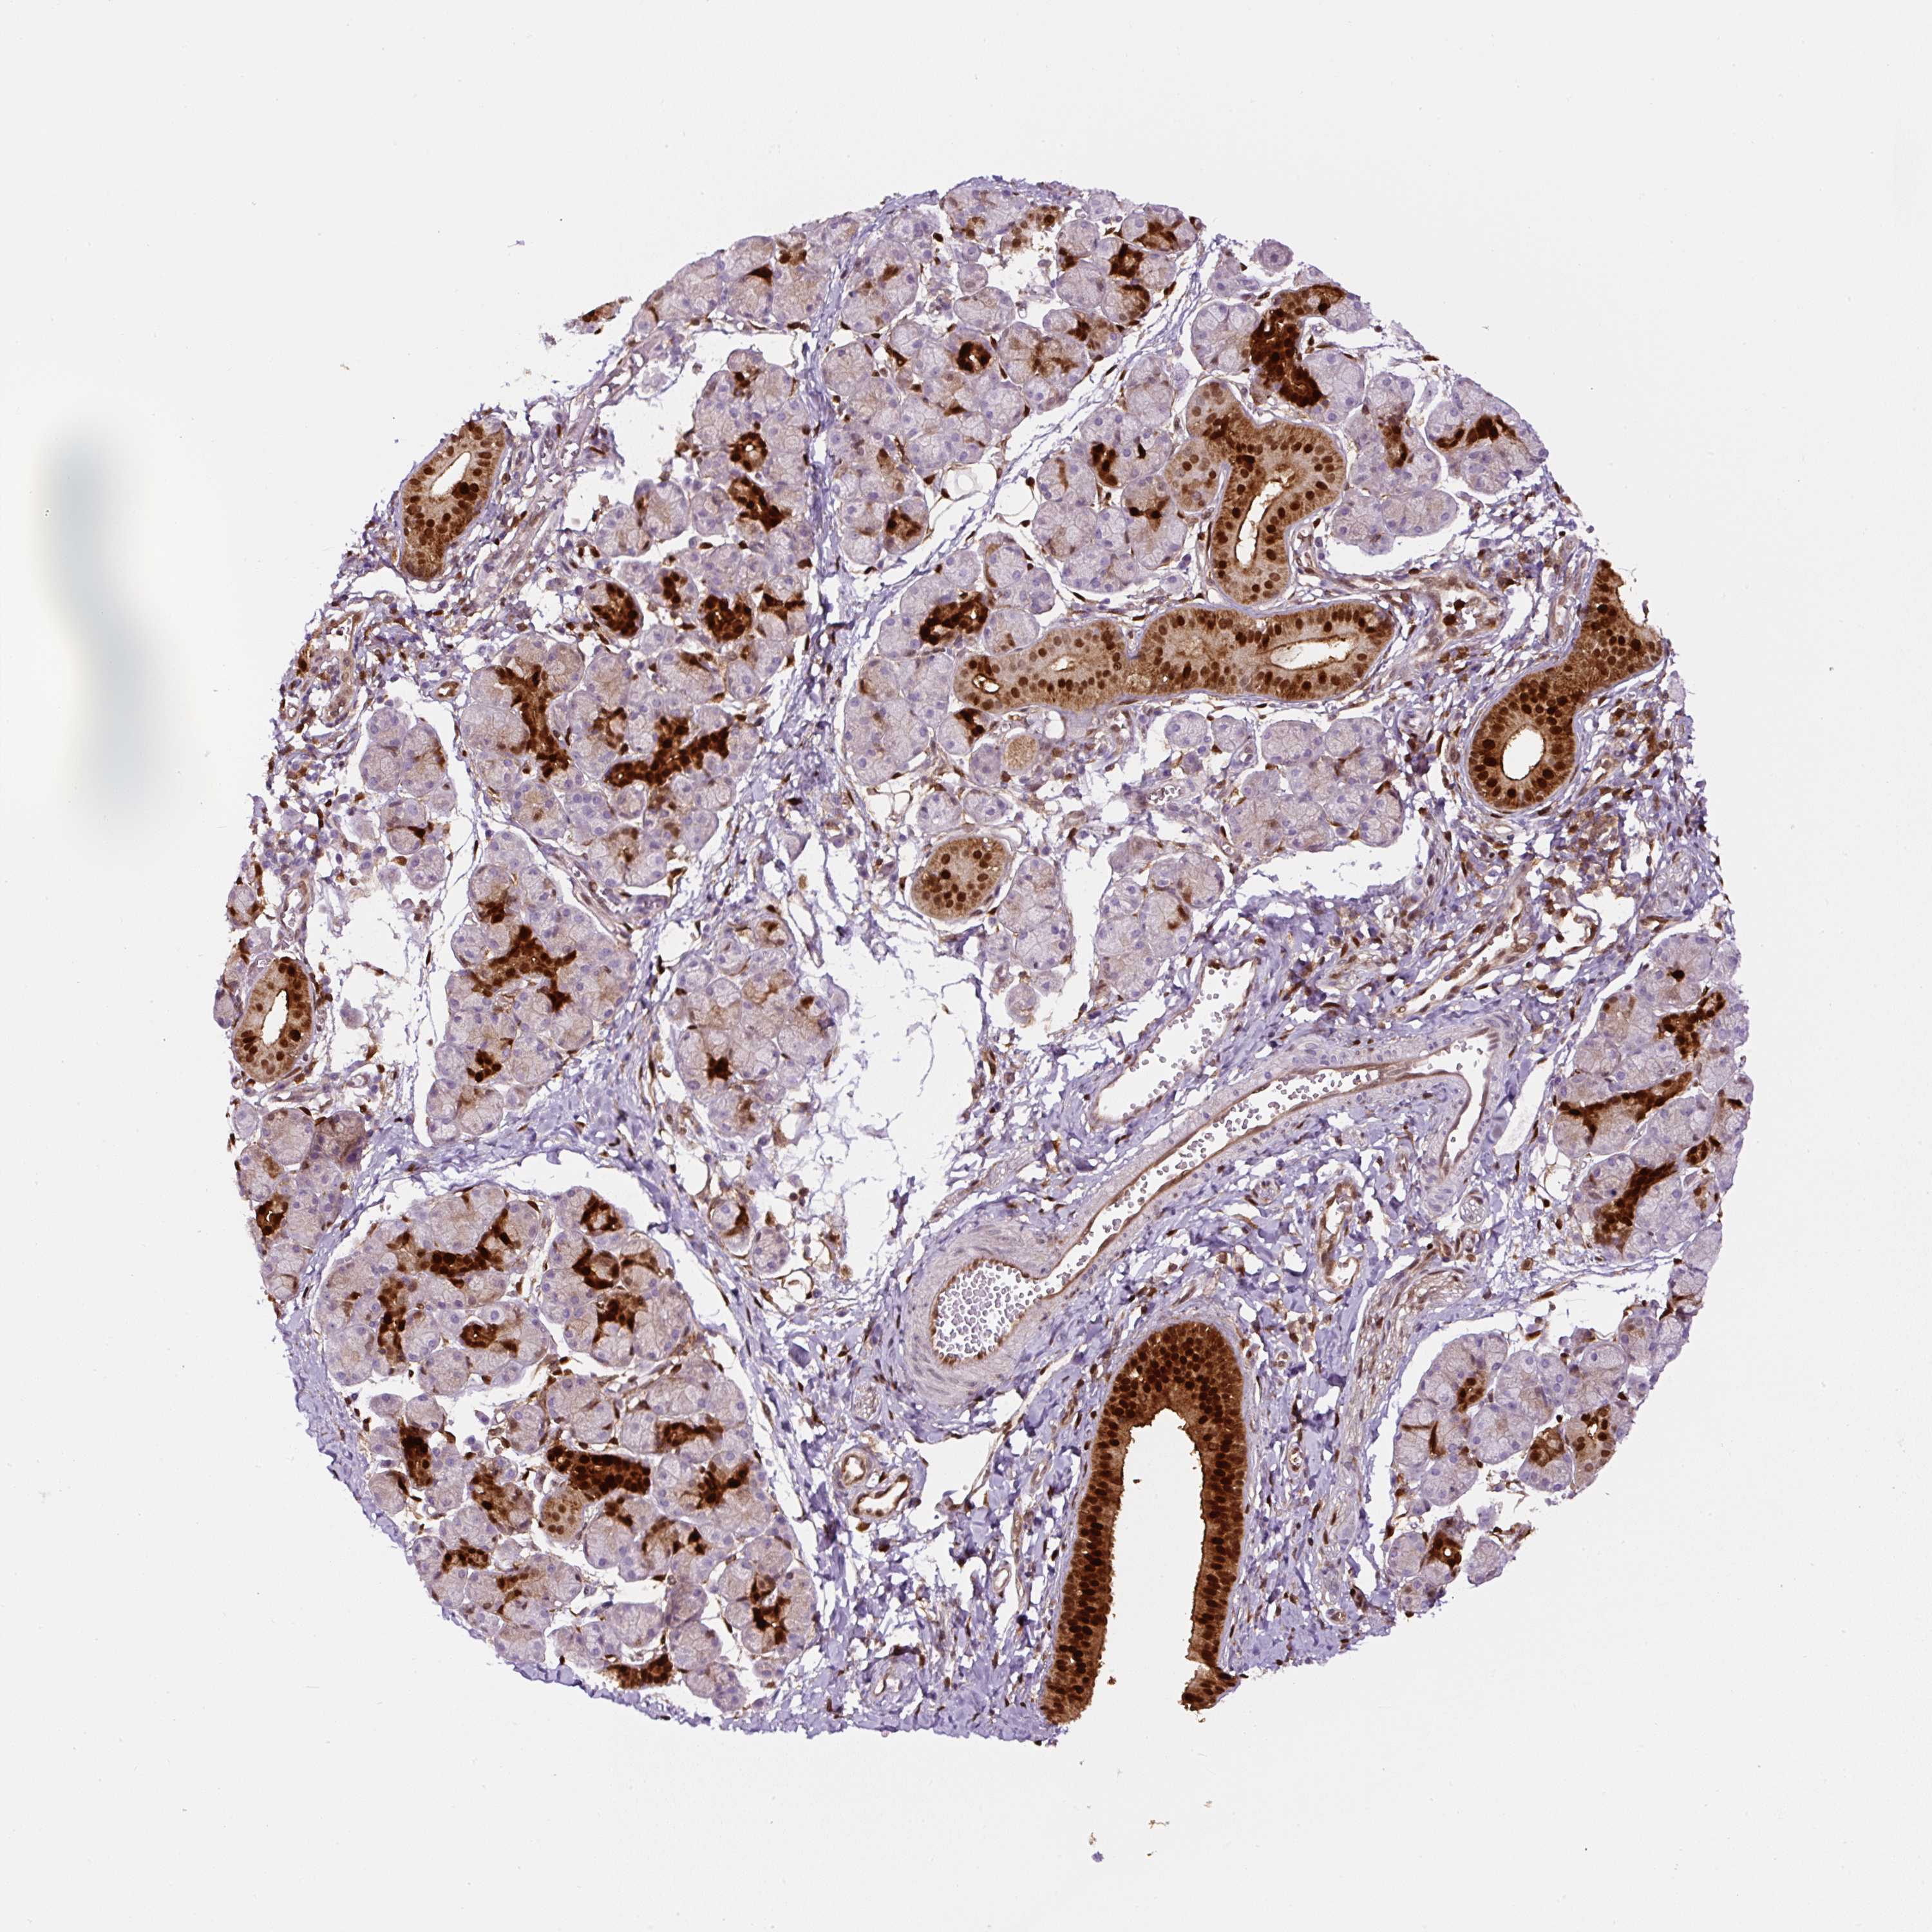
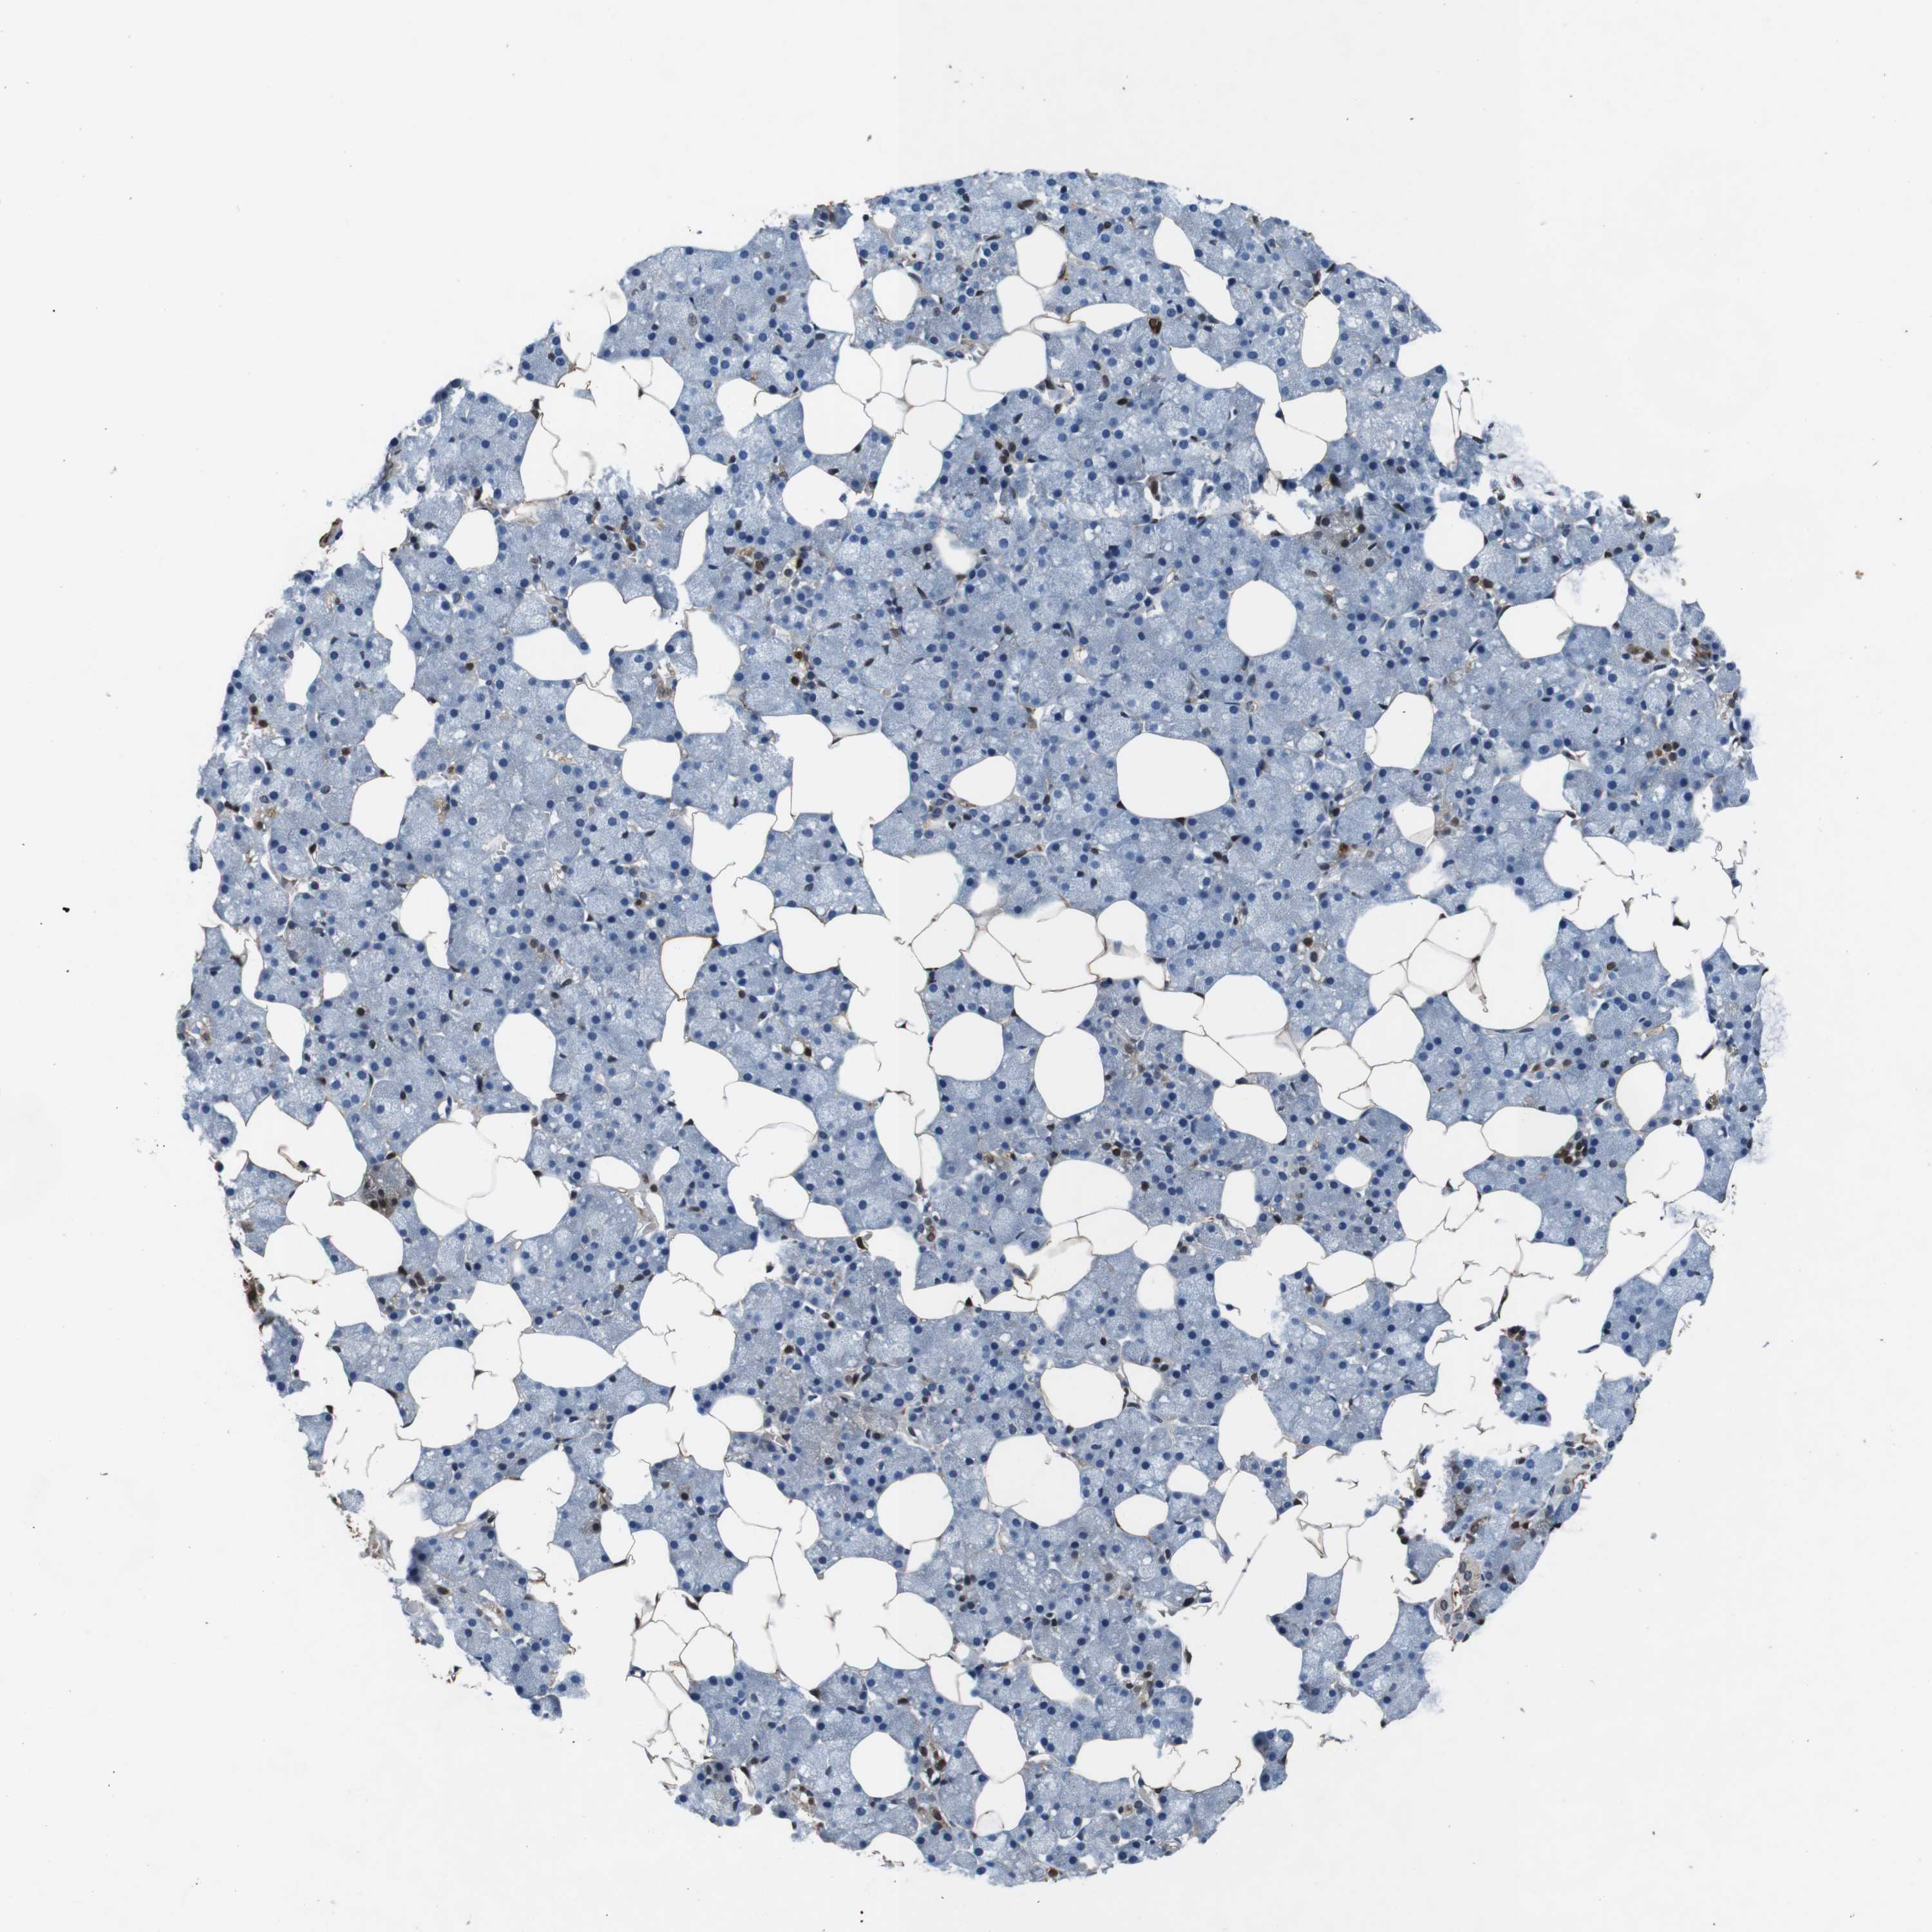
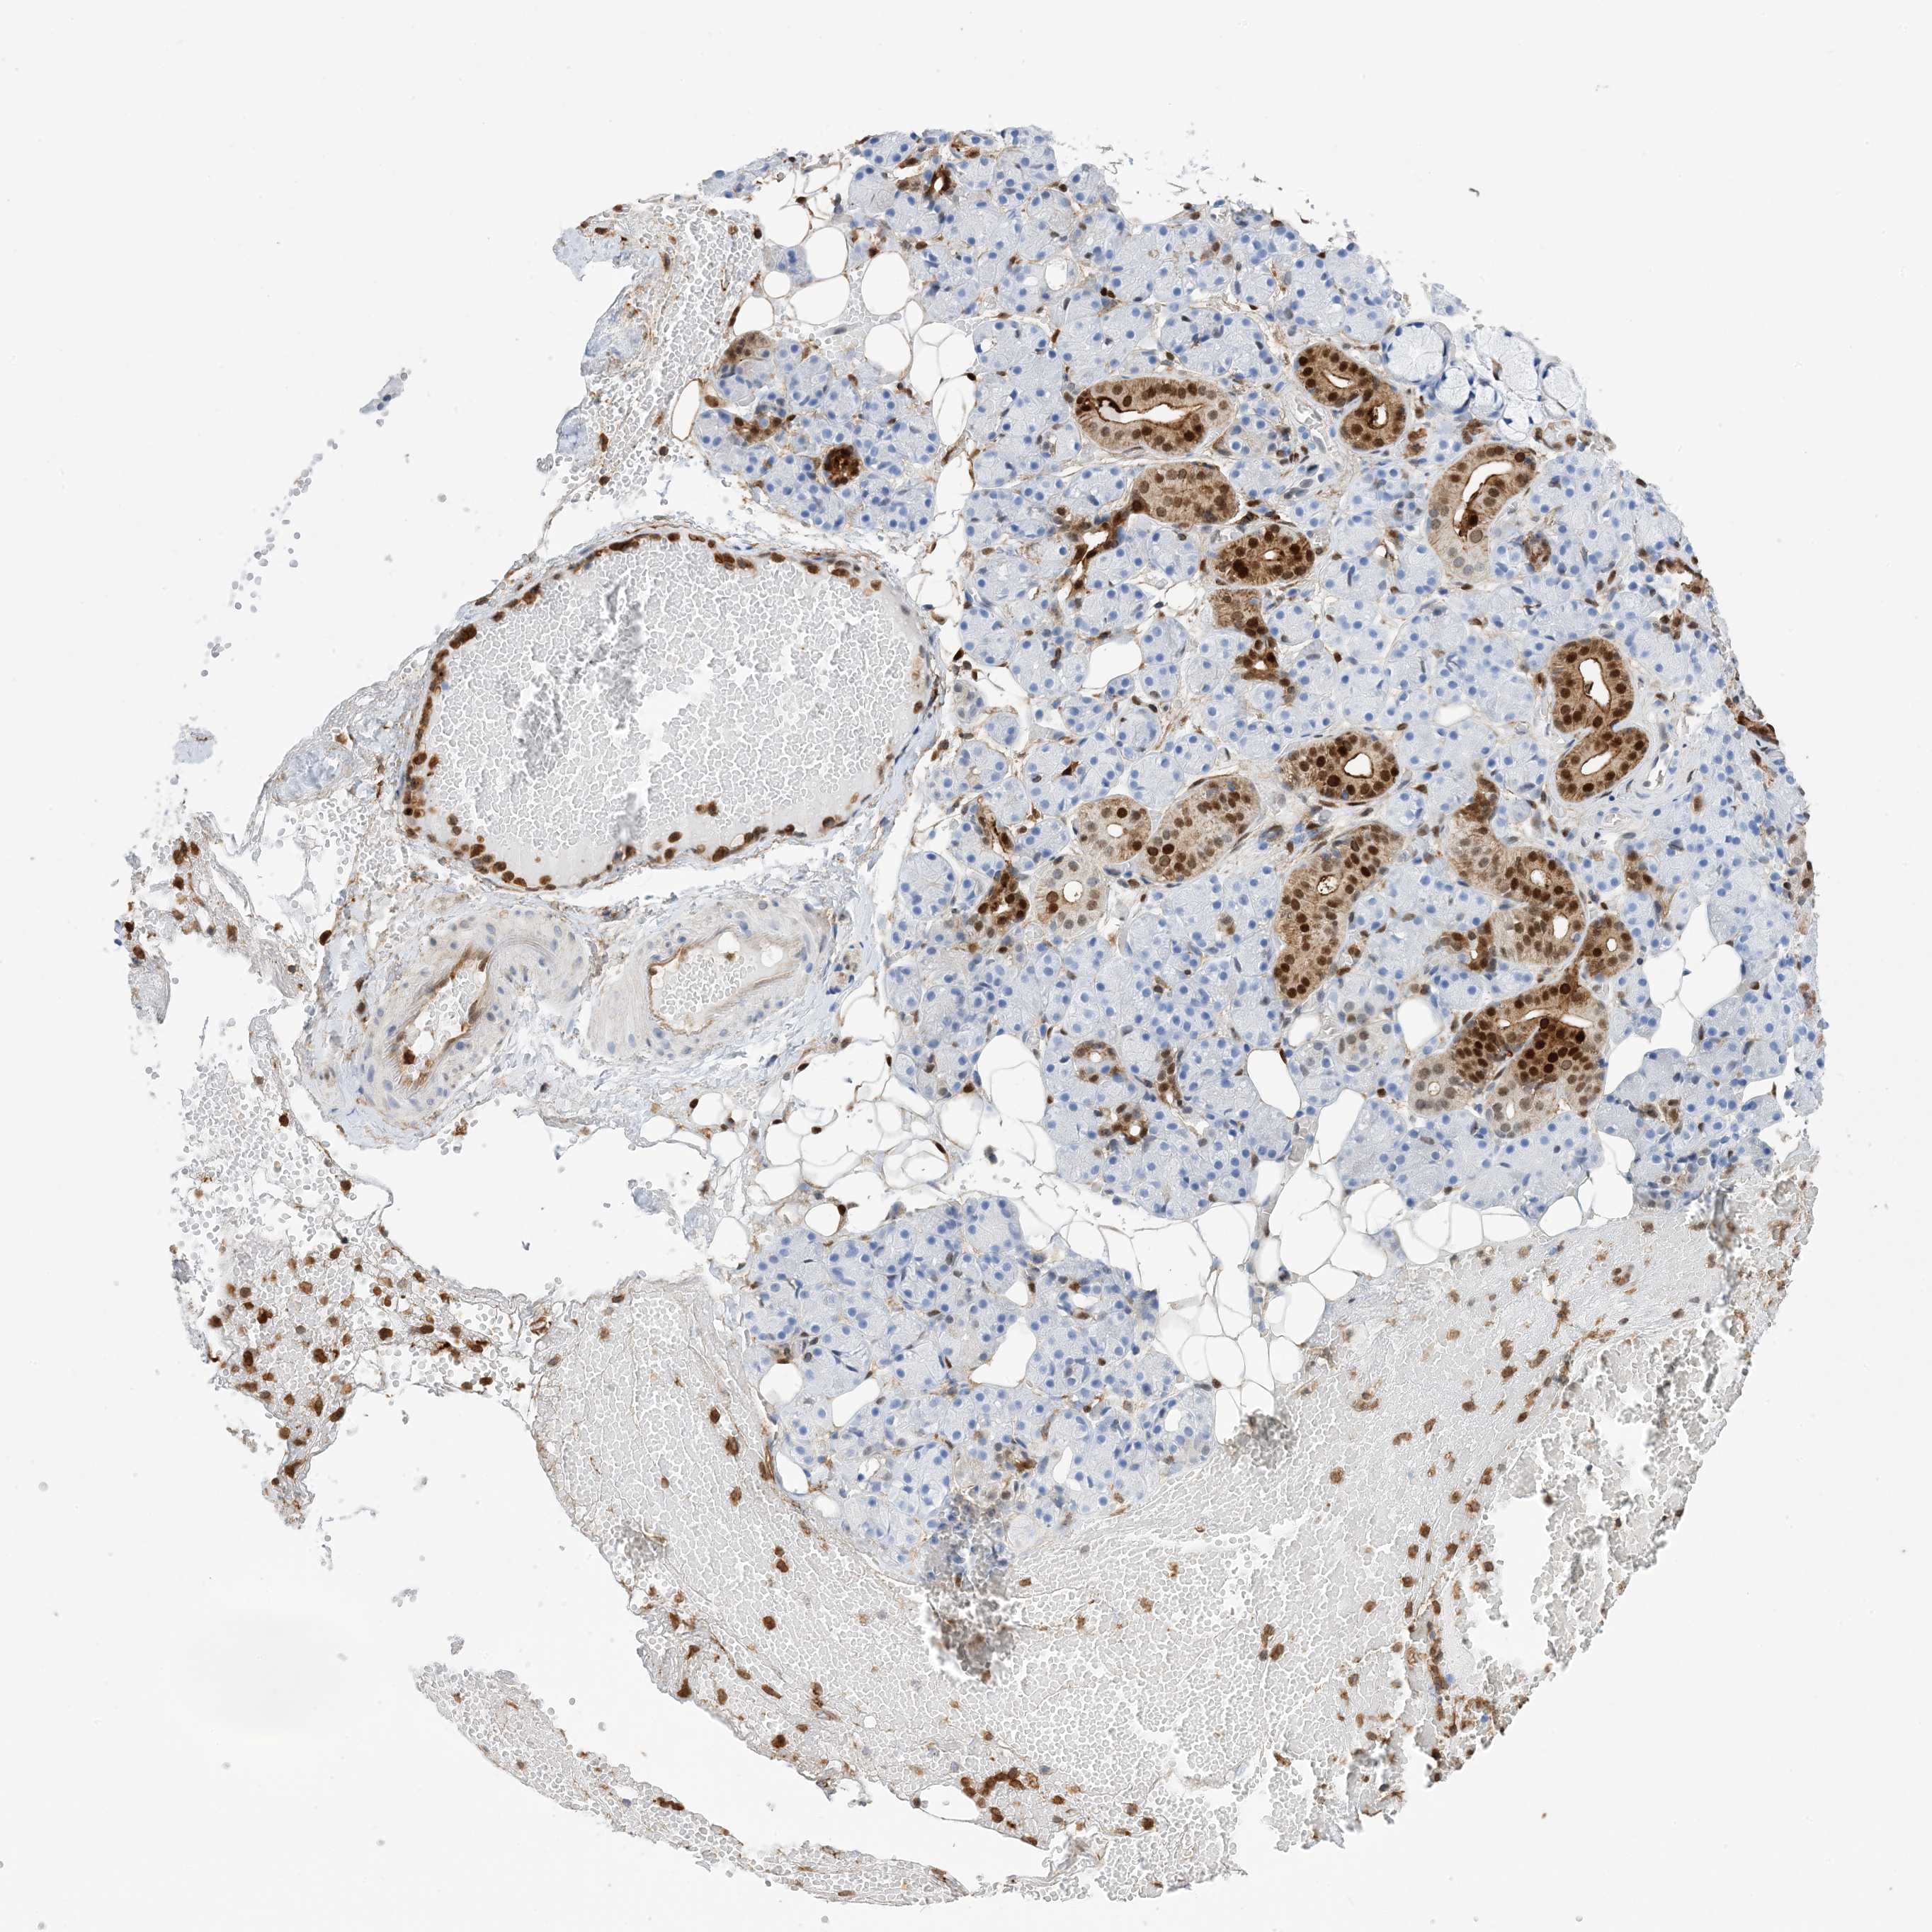
SALIVARY GLAND
GENE/PROTEIN
|
|
||||||||||||||||||||||||||||||||||||||||||||||||||||||||||||||||||||||||||||||||||||||||||||||||||||||||||||||||||||||||||||||||||||||||||||||||||||||||||||||||||||||||||||||||||||||||||||||||||||||||||||||||||||||||||||||||||||||||||||||||||
The Project
The Human Protein Atlas