We use cookies to enhance the usability of our website. If you continue, we'll assume that you are happy to receive all cookies. More information. Don't show this again.
Cytoplasmic region of segmented cells in 10x-images
Antibody dilution
1:33
Standard validation
Supported
Supported
Figure description
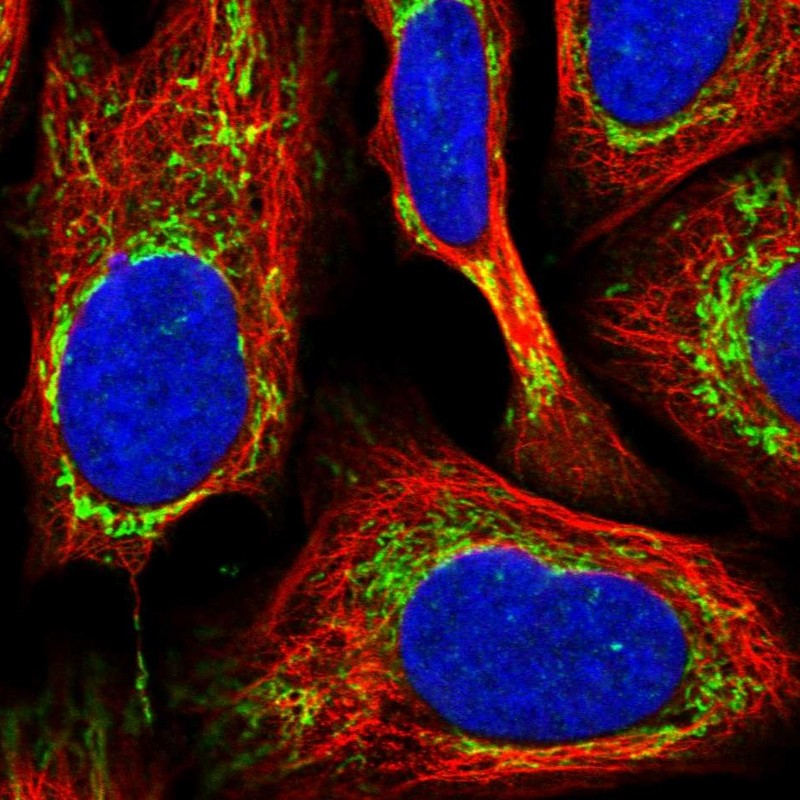
Immunofluorescent staining of human cell line U-2 OS shows localization to mitochondria.
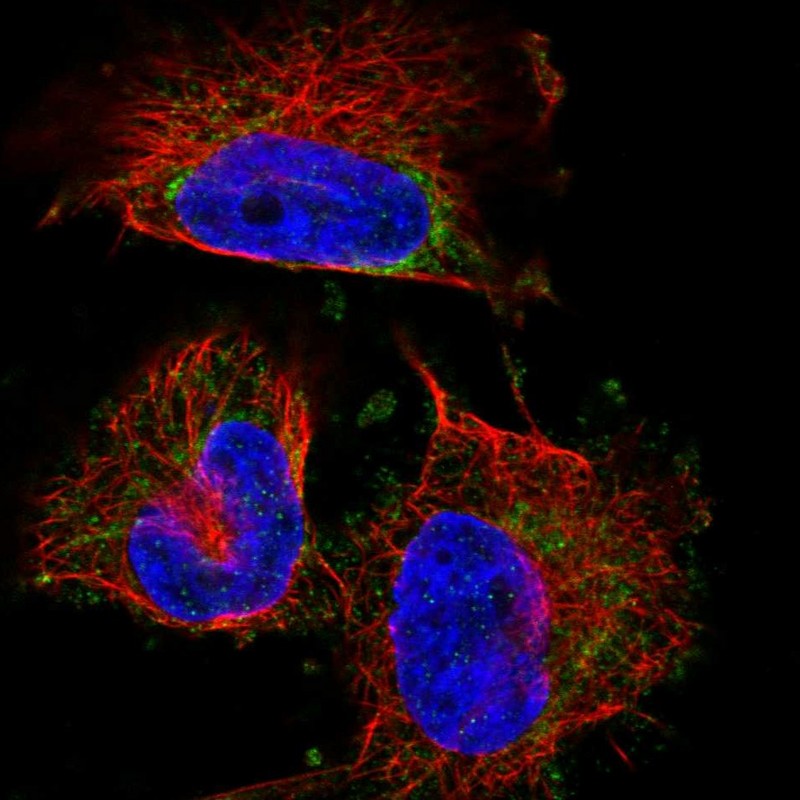
Immunofluorescent staining of human cell line U-251 MG shows localization to mitochondria.
Antibody dilution
1:20
1:125
Literature conformity
The subcellular location is supported by literature.
The subcellular location is supported by literature.
IMMUNOHISTOCHEMISTRY
Antibody HPA025770
Antibody HPA025948
Antibody HPA027341
Antibody CAB017785
Formal validation: Independent
Validated
Pearson correlation >0.6 for protein expression in cell lines using independent antibodies.
Validated
Pearson correlation >0.6 for protein expression in cell lines using independent antibodies.
Figure description
Distribution of protein expression (antibody staining). Pearson correlation with HPA027341 across 45 cell lines.
Distribution of protein expression (antibody staining). Pearson correlation with HPA025770 across 45 cell lines.
Formal validation: Independent
Validated
Spearman correlation >0.6 for protein expression in tissues using independent antibodies.
Validated
Spearman correlation >0.6 for protein expression in tissues using independent antibodies.
Validated
Spearman correlation >0.6 for protein expression in tissues using independent antibodies.
Figure description
Distribution of protein expression (antibody staining). Spearman correlation with HPA027341 across 74 cell types. Spearman correlation with HPA025948 across 74 cell types.
Distribution of protein expression (antibody staining). Spearman correlation with HPA025770 across 74 cell types.
Distribution of protein expression (antibody staining). Spearman correlation with HPA025770 across 74 cell types.
Standard validation
Supported
Supported
Supported
Supported
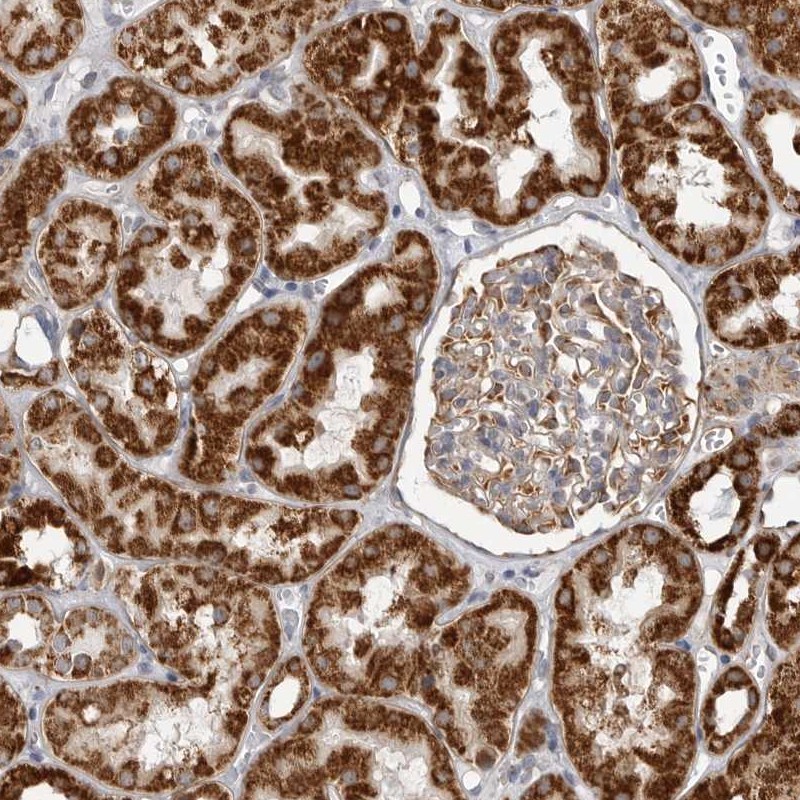
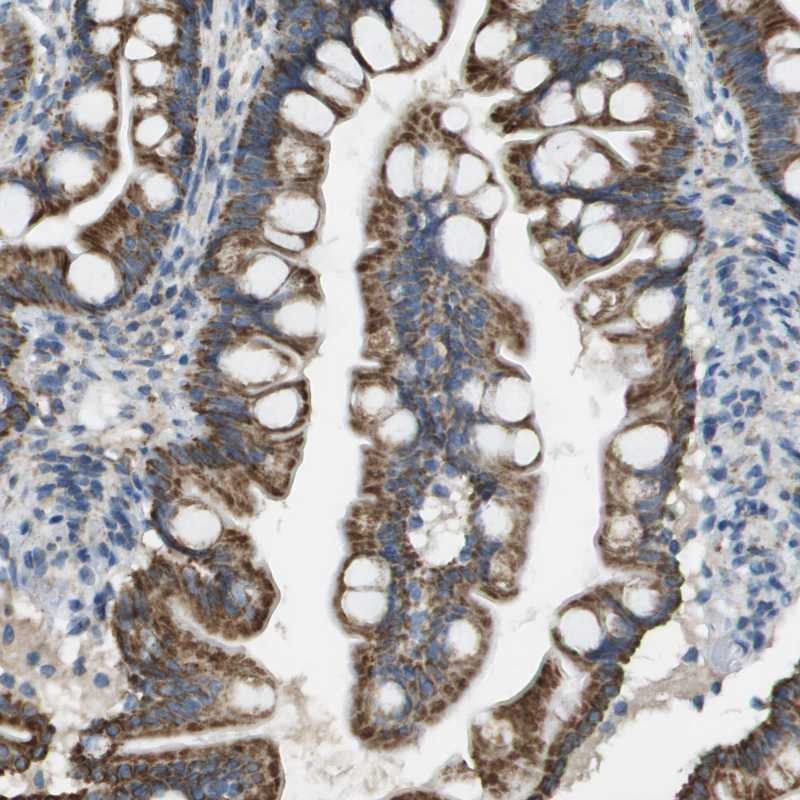
Figure description
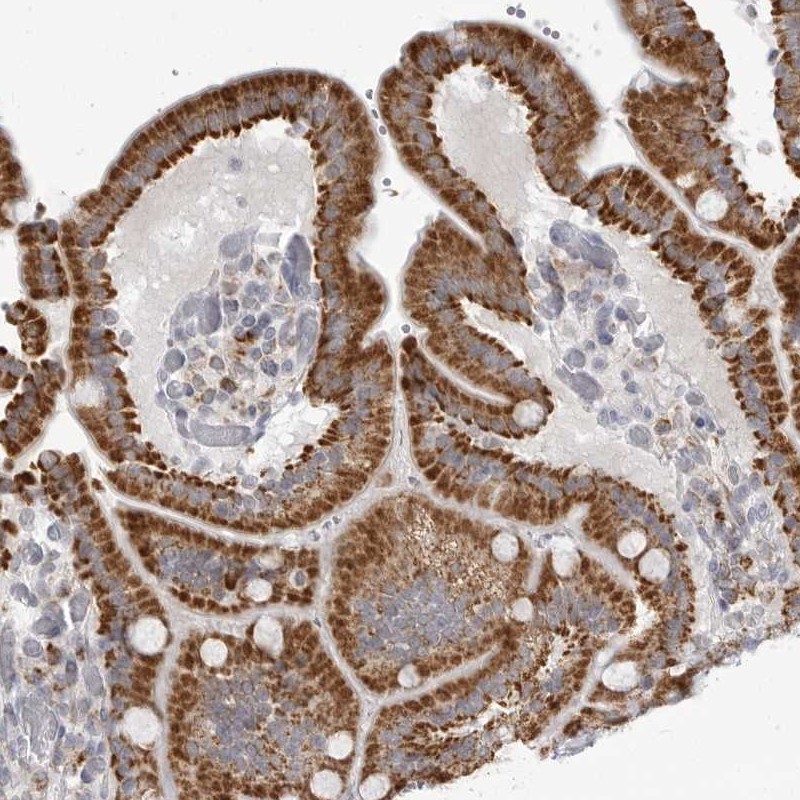
Immunohistochemical staining of human duodenum shows strong granular cytoplasmic positivity in glandular cells.
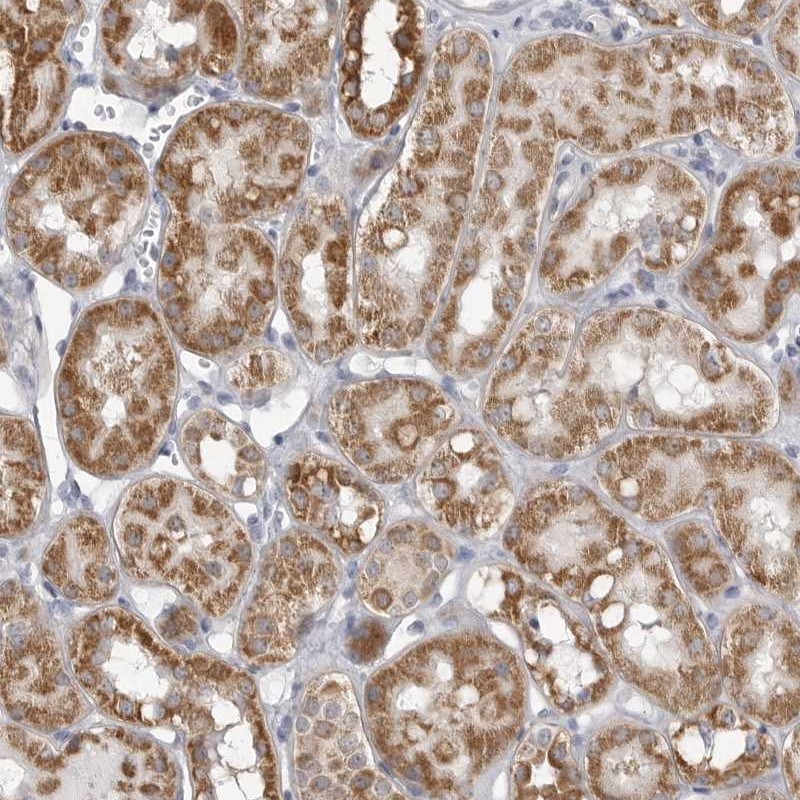
Immunohistochemical staining of human kidney shows moderate cytoplasmic positivity in tubular cells.
Immunohistochemical staining of human kidney shows strong cytoplasmic positivity with a granular pattern in tubular cells.
Immunohistochemical staining of human small intestine shows strong cytoplasmic positivity with a granular pattern in glandular cells.
Expression
RNA: detected in 37 tissues Protein: detected in 54 cell types
RNA: detected in 37 tissues Protein: detected in 32 cell types
RNA: detected in 37 tissues Protein: detected in 81 cell types
RNA: detected in 37 tissues Protein: detected in 66 cell types
Retrieval
HIER pH6
HIER pH6
HIER pH6
HIER pH6
Antibody dilution
1:500
1:50
1:1750
1:500
Literature conformity
Consistent with extensive gene/protein characterization data.
Consistent with extensive gene/protein characterization data.
Consistent with extensive gene/protein characterization data.
Consistent with extensive gene/protein characterization data.
RNA consistency
Consistent with RNA expression data.
Consistent with RNA expression data.
Consistent with RNA expression data.
Consistent with RNA expression data.
Standard validation
Approved
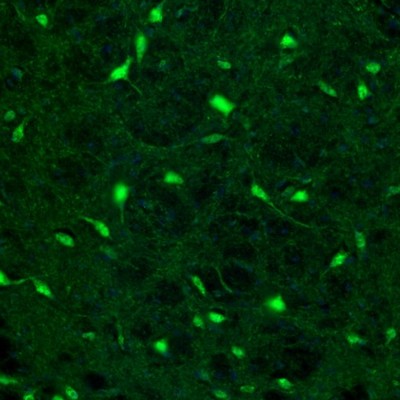
Figure description
Positivity observed in cell bodies of subsets of neurons, most abundant in cortex and hippocampus.
WESTERN BLOT
Antibody HPA025770
Antibody HPA025948
Antibody HPA027341
Antibody CAB017785
Formal validation: Genetic
Validated
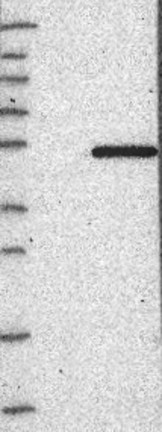
Downregulation visible in one of two siRNA lanes
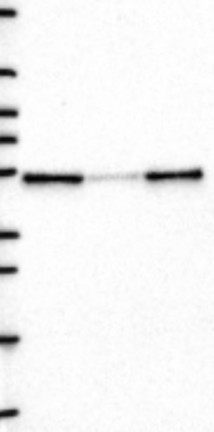
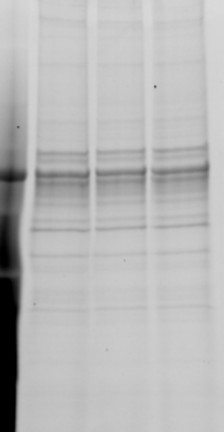
Figure description
Lane 1: Marker [kDa] 250, 130, 95, 72, 55, 36, 28, 17, 10 Lane 2: siRNA 1 Lane 3: siRNA 2 Lane 4: Scrambled
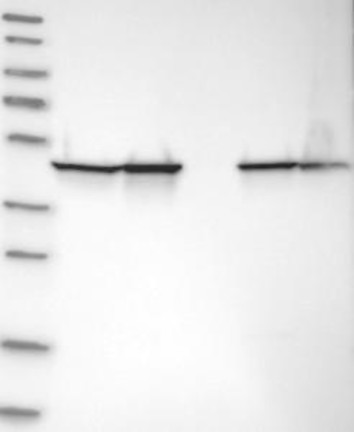
Analysis performed using a standard panel of samples. Single band corresponding to the predicted size in kDa (+/-20%).
Supported
Single band corresponding to the predicted size in kDa (+/-20%).
Supported
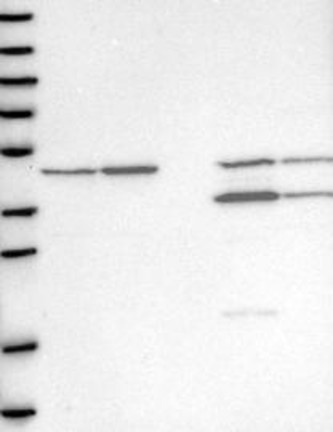
Analysis performed using a standard panel of samples. Band of predicted size in kDa (+/-20%) with additional bands present.
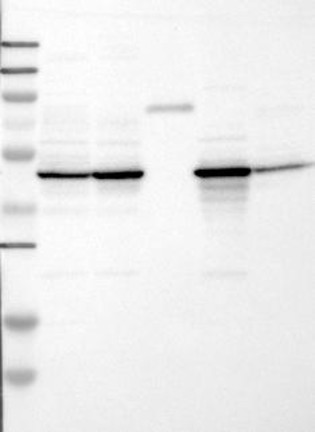
Supported
Analysis performed using a standard panel of samples. Band of predicted size in kDa (+/-20%) with additional bands present.
Figure description
Lane 1: Marker [kDa] 230, 130, 95, 72, 56, 36, 28, 17, 11 Lane 2: RT4 Lane 3: U-251 MG Lane 4: Human Plasma Lane 5: Liver Lane 6: Tonsil
Lane 1: Marker [kDa] 250, 130, 95, 72, 55, 36, 28, 17, 10 Lane 2: Negative control (vector only transfected HEK293T lysate) Lane 3: Over-expression Lysate (Co-expressed with a C-terminal myc-DDK tag (~3.1 kDa) in mammalian HEK293T cells, LY400053)
Lane 1: Marker [kDa] 230, 130, 95, 72, 56, 36, 28, 17, 11 Lane 2: RT4 Lane 3: U-251 MG Lane 4: Human Plasma Lane 5: Liver Lane 6: Tonsil
Lane 1: Marker [kDa] 250, 130, 95, 72, 55, 36, 28, 17, 11 Lane 2: RT4 Lane 3: U-251 MG Lane 4: Human Plasma Lane 5: Liver Lane 6: Tonsil
Target mass (kDa)
54.6
54.6
54.6
54.6
Antibody dilution
1:250
1:250
1:250
1:500
PROTEIN ARRAY
Antibody HPA025770
Antibody HPA025948
Antibody HPA027341
Antibody CAB017785
Standard validation
Approved
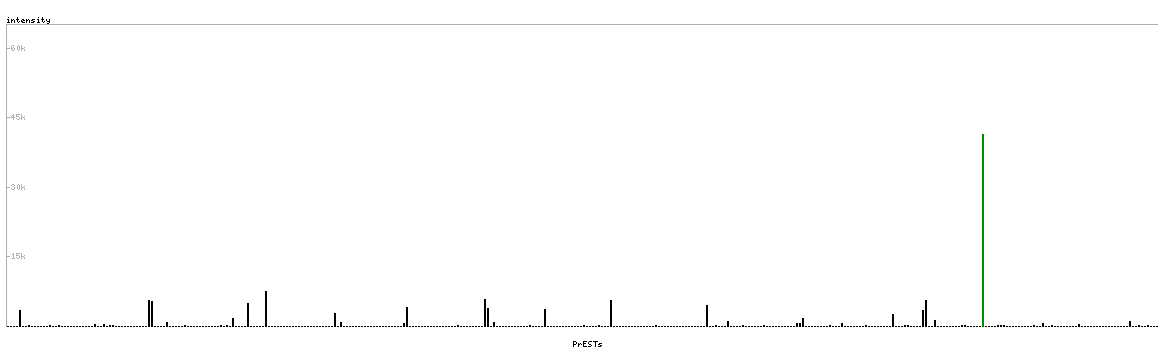
Pass with quality comment low specificity (binding to 1-2 PrESTs >15% and <40%).
Supported
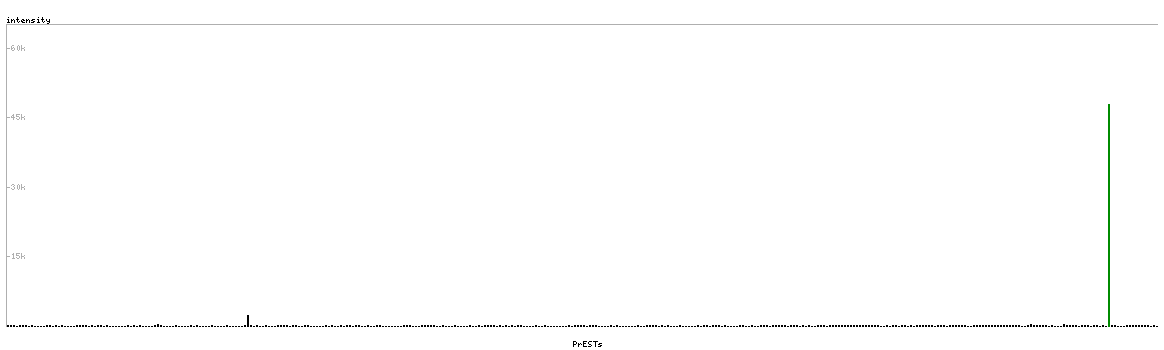
Pass with single peak corresponding to interaction only with its own antigen.
Supported
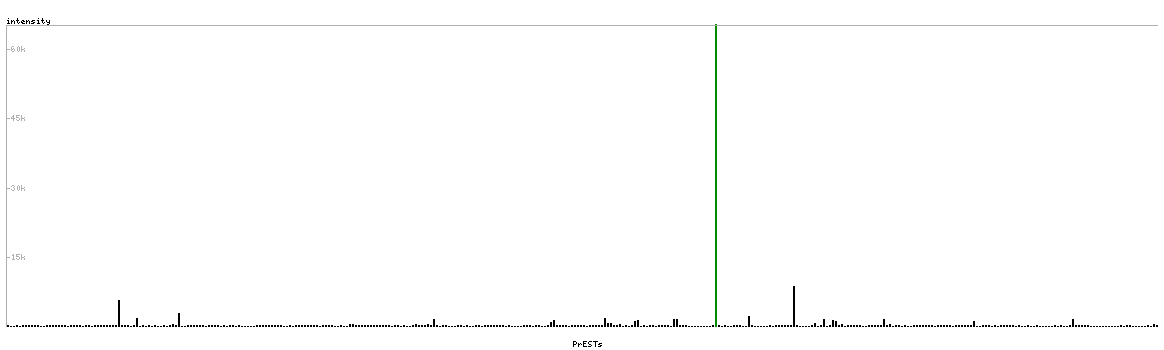
Pass with single peak corresponding to interaction only with its own antigen.
Figure description
Antibody specificity analysis with protein arrays. Predicted and matching interactions are shown in green.
Antibody specificity analysis with protein arrays. Predicted and matching interactions are shown in green.
Antibody specificity analysis with protein arrays. Predicted and matching interactions are shown in green.


