We use cookies to enhance the usability of our website. If you continue, we'll assume that you are happy to receive all cookies. More information. Don't show this again.
Immunofluorescent staining of human cell line U-251 MG shows localization to the Golgi apparatus & vesicles.
Immunofluorescent staining of human cell line A-431 shows localization to vesicles.
Antibody dilution
1:20
1:7
Literature conformity
The subcellular location is partly supported by literature or no literature is available.
The subcellular location is partly supported by literature or no literature is available.
IMMUNOHISTOCHEMISTRY
Antibody HPA028177
Antibody HPA028180
Antibody HPA028182
Standard validation
Uncertain
Uncertain
Uncertain
Figure description
Immunohistochemical staining of human cerebellum shows strong positivity in neuropil.
Immunohistochemical staining of human epididymis shows moderate cytoplasmic positivity in glandular cells and sperm cells.
Immunohistochemical staining of human colon shows moderate cytoplasmic positivity in glandular cells.
Expression
RNA: detected in 37 tissues Protein: detected in 24 cell types
RNA: detected in 37 tissues Protein: detected in 25 cell types
RNA: detected in 37 tissues Protein: detected in 67 cell types
Retrieval
HIER pH6
HIER pH6
HIER pH6
Antibody dilution
1:25
1:10
1:15
Literature conformity
No avaliable gene/protein characterization data.
No avaliable gene/protein characterization data.
No avaliable gene/protein characterization data.
RNA consistency
Not consistent with RNA expression data.
Mainly not consistent with RNA expression data.
Mainly not consistent with RNA expression data.
WESTERN BLOT
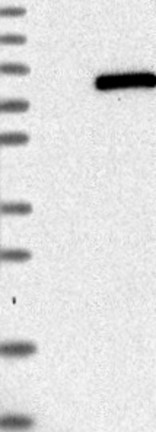
Antibody HPA028177
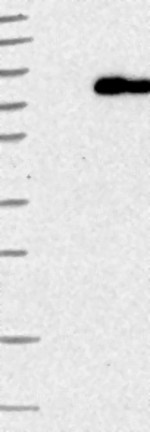
Antibody HPA028180
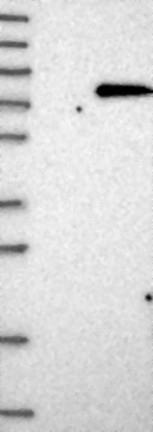
Antibody HPA028182
Standard validation
Supported
Single band corresponding to the predicted size in kDa (+/-20%).
Supported
Single band corresponding to the predicted size in kDa (+/-20%).
Supported
Single band corresponding to the predicted size in kDa (+/-20%).
Figure description
Lane 1: Marker [kDa] 250, 130, 95, 72, 55, 36, 28, 17, 10 Lane 2: Negative control (vector only transfected HEK293T lysate) Lane 3: Over-expression Lysate (Co-expressed with a C-terminal myc-DDK tag (~3.1 kDa) in mammalian HEK293T cells, LY414858)
Lane 1: Marker [kDa] 250, 130, 95, 72, 55, 36, 28, 17, 10 Lane 2: Negative control (vector only transfected HEK293T lysate) Lane 3: Over-expression Lysate (Co-expressed with a C-terminal myc-DDK tag (~3.1 kDa) in mammalian HEK293T cells, LY414858)
Lane 1: Marker [kDa] 250, 130, 95, 72, 55, 36, 28, 17, 10 Lane 2: Negative control (vector only transfected HEK293T lysate) Lane 3: Over-expression Lysate (Co-expressed with a C-terminal myc-DDK tag (~3.1 kDa) in mammalian HEK293T cells, LY414858)
Target mass (kDa)
75.9, 75.8
75.9, 75.8
75.9, 75.8
Antibody dilution
1:250
1:250
1:250
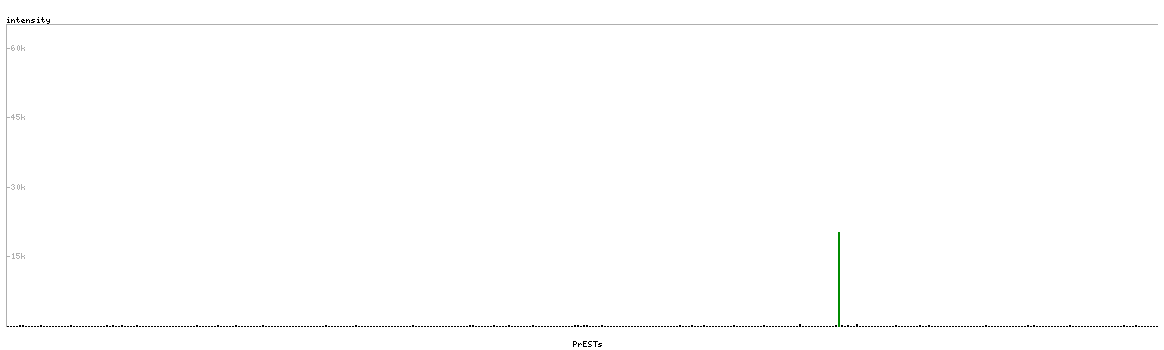
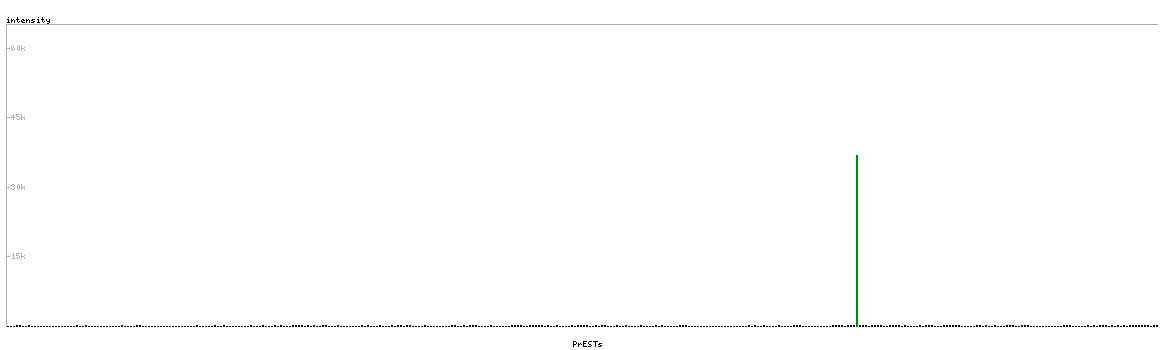
PROTEIN ARRAY
Antibody HPA028177
Antibody HPA028180
Antibody HPA028182
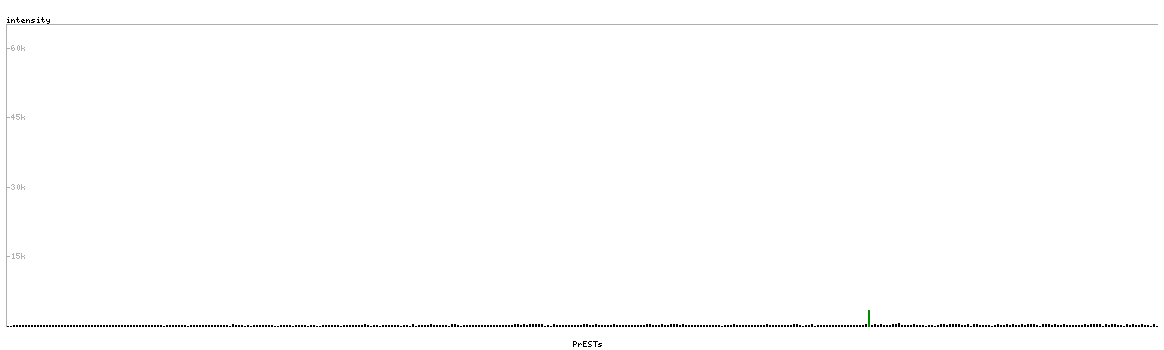
Standard validation
Supported
Pass with single peak corresponding to interaction only with its own antigen.
Supported
Pass with single peak corresponding to interaction only with its own antigen.
Supported
Pass with single peak corresponding to interaction only with its own antigen.
Figure description
Antibody specificity analysis with protein arrays. Predicted and matching interactions are shown in green.
Antibody specificity analysis with protein arrays. Predicted and matching interactions are shown in green.
Antibody specificity analysis with protein arrays. Predicted and matching interactions are shown in green.