We use cookies to enhance the usability of our website. If you continue, we'll assume that you are happy to receive all cookies. More information. Don't show this again.
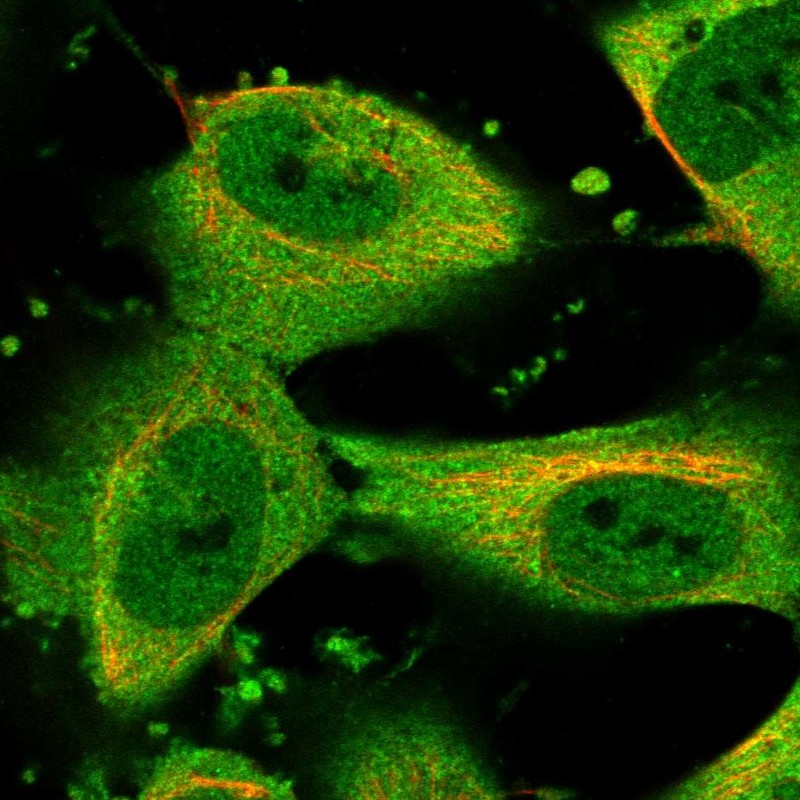
Immunofluorescent staining of human cell line U-251 MG shows localization to nucleoplasm & cytosol.
Antibody dilution
1:10
Literature conformity
The subcellular location is not consistent with literature.
IMMUNOHISTOCHEMISTRY
Antibody HPA020265
Antibody HPA027735
Formal validation: Independent
Validated
Spearman correlation >0.6 for protein expression in tissues using independent antibodies.
Validated
Spearman correlation >0.6 for protein expression in tissues using independent antibodies.
Figure description
Distribution of protein expression (antibody staining). Spearman correlation with HPA027735 across 69 cell types.
Distribution of protein expression (antibody staining). Spearman correlation with HPA020265 across 69 cell types.
Standard validation
Supported
Supported
Figure description
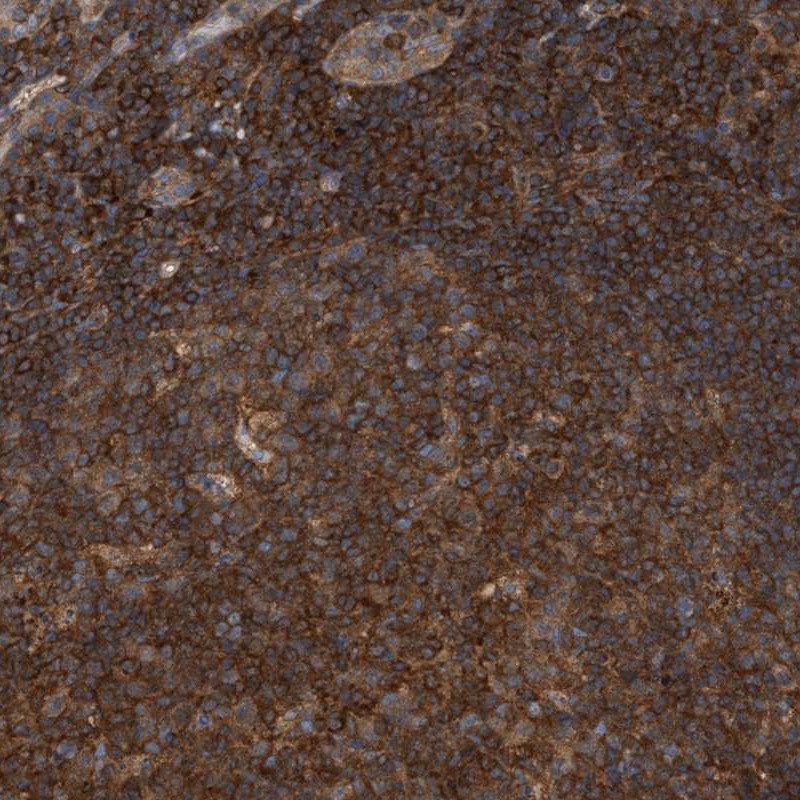
Immunohistochemical staining of human tonsil shows strong cytoplasmic positivity in reaction center cells and lymphoid cells outside reaction centra.
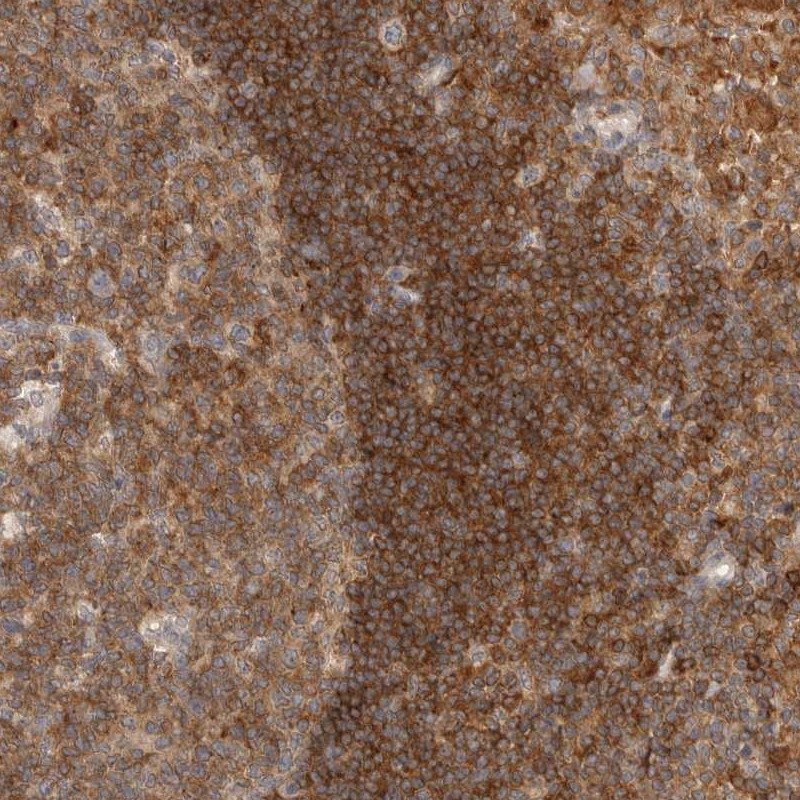
Immunohistochemical staining of human lymph node shows distinct cytoplasmic positivity in both reaction centre cells and in lymphoid cells outside reaction centra.
Expression
RNA: detected in 37 tissues Protein: detected in 64 cell types
RNA: detected in 37 tissues Protein: detected in 56 cell types
Retrieval
HIER pH6
HIER pH6
Antibody dilution
1:15
1:25
Literature conformity
Consistent with extensive gene/protein characterization data.
Consistent with extensive gene/protein characterization data.
RNA consistency
Mainly consistent with RNA expression data.
Mainly consistent with RNA expression data.
WESTERN BLOT
Antibody HPA020265
Antibody HPA027735
Standard validation
Supported
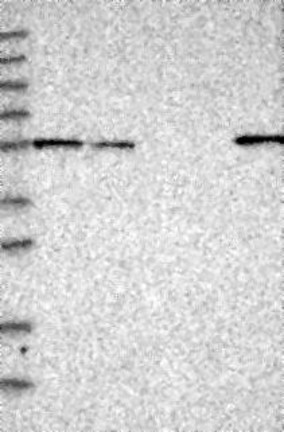
Analysis performed using a standard panel of samples. Single band corresponding to the predicted size in kDa (+/-20%).
Supported
Analysis performed using a standard panel of samples. Single band corresponding to the predicted size in kDa (+/-20%).
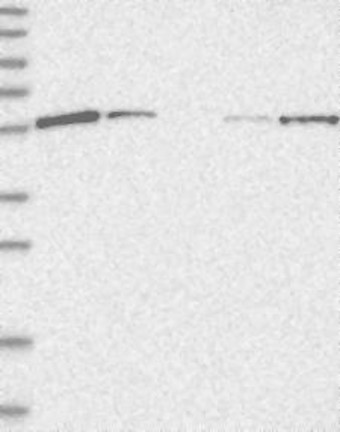
Figure description
Lane 1: Marker [kDa] 230, 130, 95, 72, 56, 36, 28, 17, 11 Lane 2: RT4 Lane 3: U-251 MG Lane 4: Human Plasma Lane 5: Liver Lane 6: Tonsil
Lane 1: Marker [kDa] 230, 130, 95, 72, 56, 36, 28, 17, 11 Lane 2: RT4 Lane 3: U-251 MG Lane 4: Human Plasma Lane 5: Liver Lane 6: Tonsil
Target mass (kDa)
49, 48.3, 48.2, 40.2
49, 48.3, 48.2, 45.7, 43, 40.2, 38, 37.1, 15.1
Antibody dilution
1:250
1:250
PROTEIN ARRAY
Antibody HPA020265
Antibody HPA027735
Standard validation
Supported
Pass with single peak corresponding to interaction only with its own antigen.
Supported
Pass with single peak corresponding to interaction only with its own antigen.
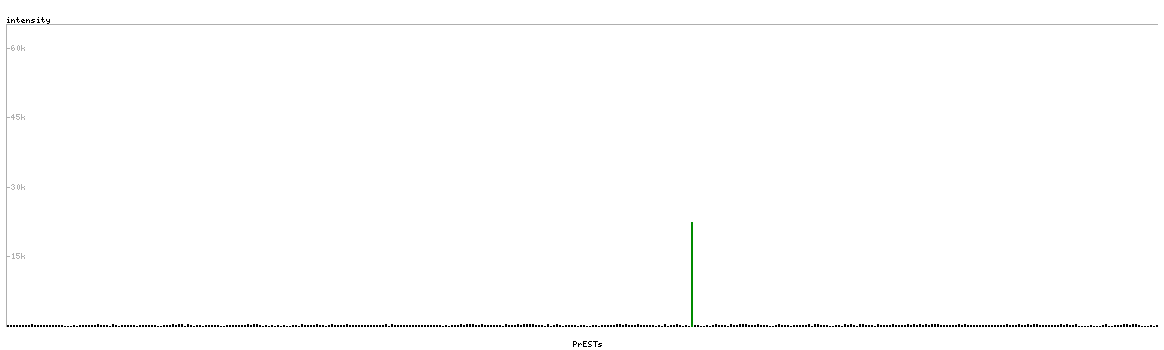
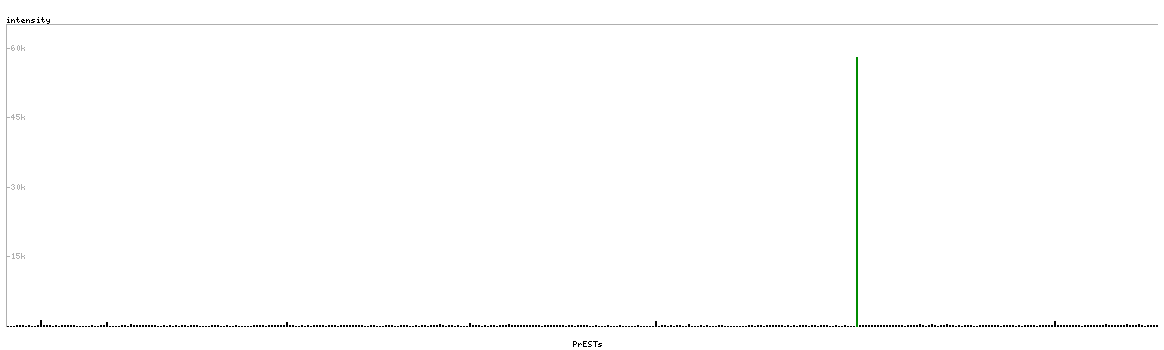
Figure description
Antibody specificity analysis with protein arrays. Predicted and matching interactions are shown in green.
Antibody specificity analysis with protein arrays. Predicted and matching interactions are shown in green.