We use cookies to enhance the usability of our website. If you continue, we'll assume that you are happy to receive all cookies. More information. Don't show this again.
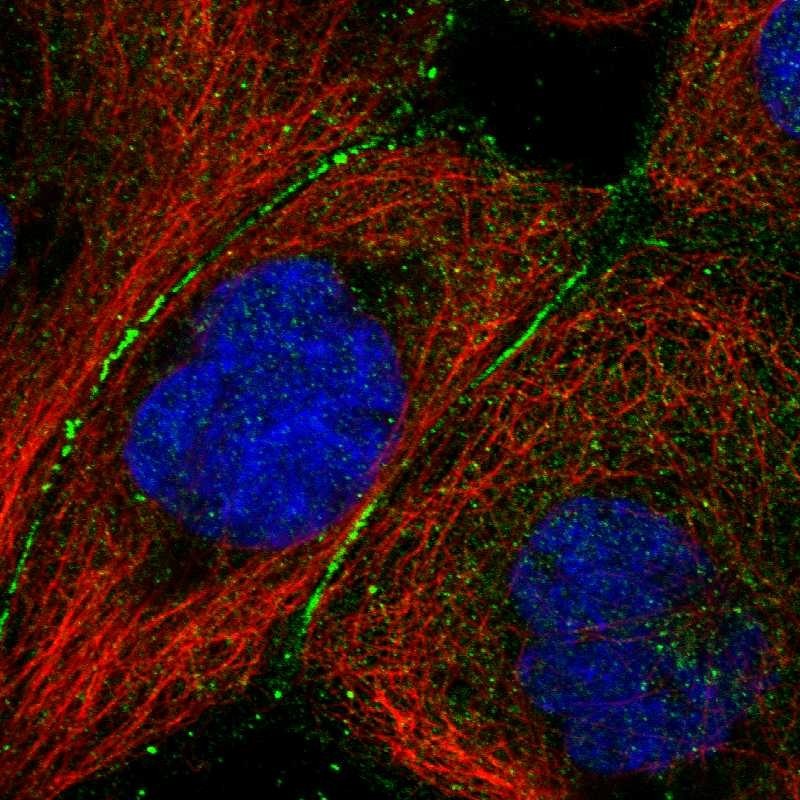
Immunofluorescent staining of human cell line A-431 shows localization to cell junctions.
Antibody dilution
1:8
Literature conformity
The subcellular location is partly supported by literature or no literature is available.
IMMUNOHISTOCHEMISTRY
Antibody HPA000951
Antibody HPA001817
Antibody HPA001832
Antibody CAB016381
Standard validation
Supported
Supported
Supported
Figure description
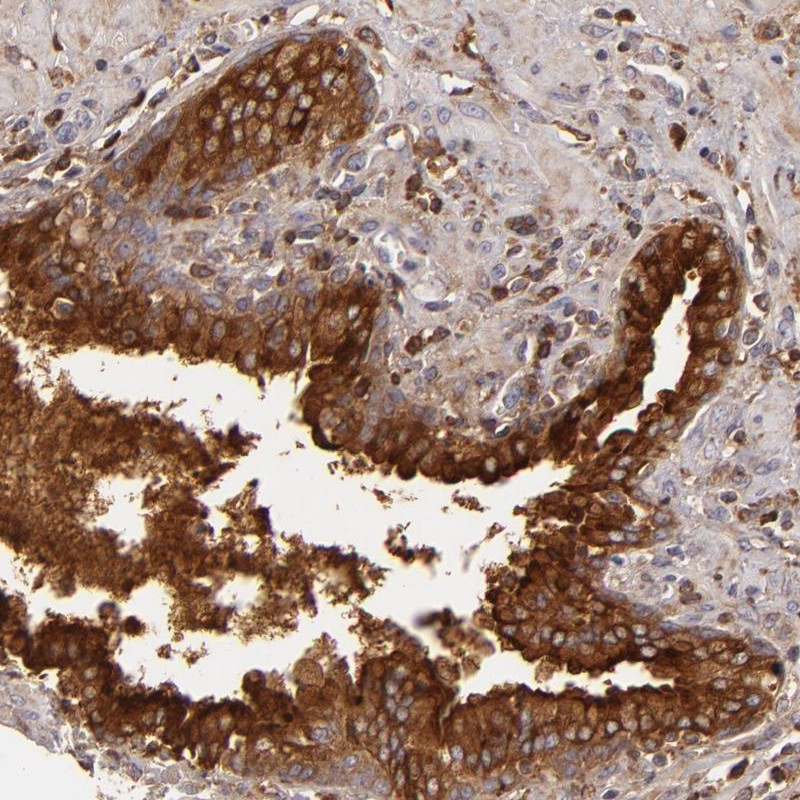
Immunohistochemical staining of human prostate shows strong cytoplasmic and membranous positivity in glandular cells.
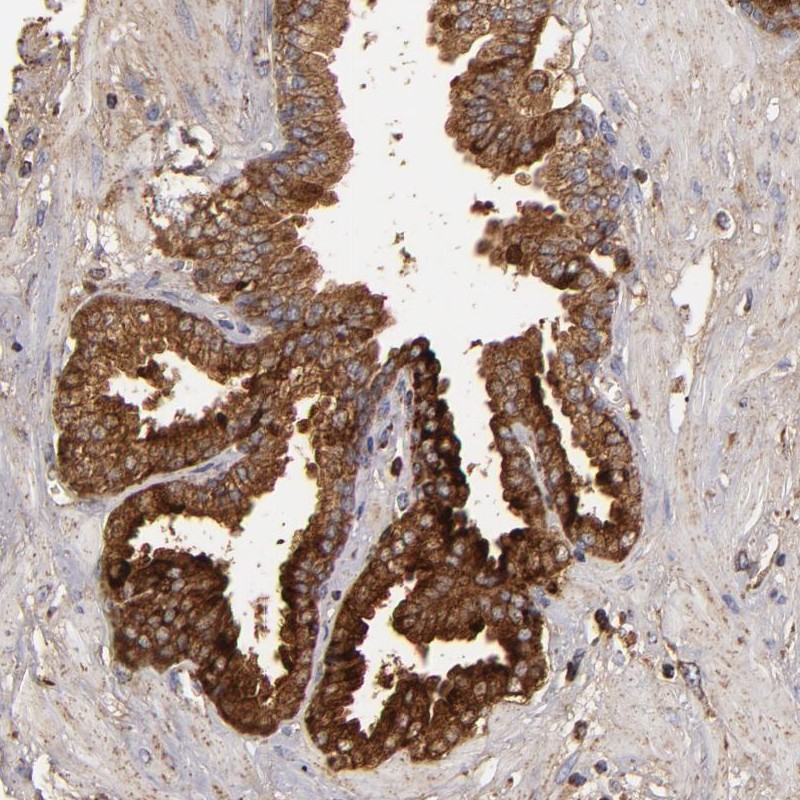
Immunohistochemical staining of human prostate shows strong cytoplasmic positivity in glandular cells.
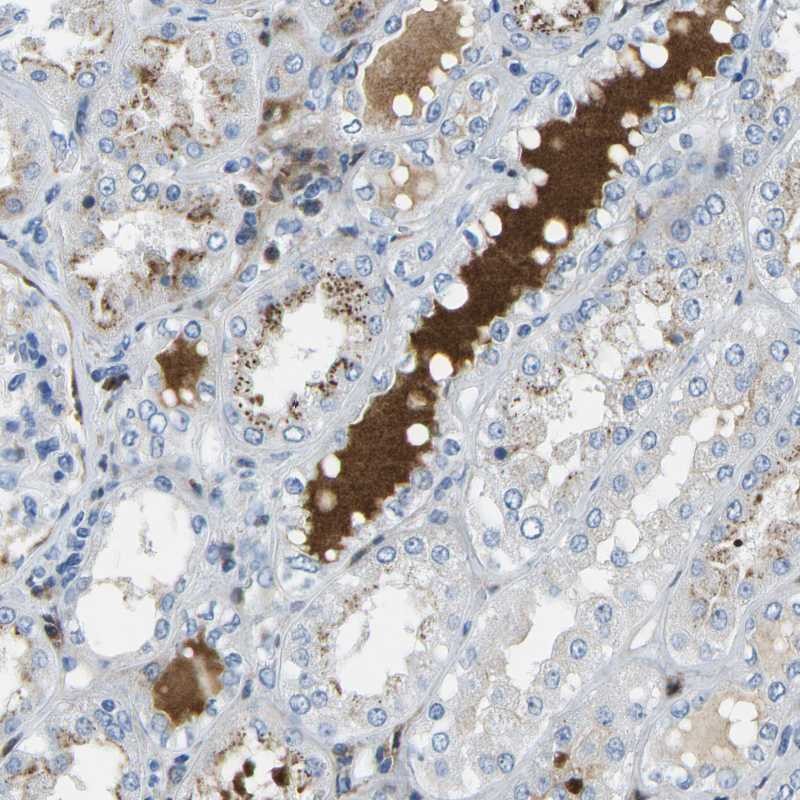
Immunohistochemical staining of human kidney shows distinct positivity in extracellular material.
Expression
RNA: detected in 25 tissues Protein: detected in 58 cell types
RNA: detected in 25 tissues Protein: detected in 66 cell types
RNA: detected in 25 tissues Protein: detected in 30 cell types
Retrieval
HIER pH6
HIER pH6
HIER pH6
Antibody dilution
1:250
1:250
1:150
Literature conformity
Consistent with extensive gene/protein characterization data.
Consistent with extensive gene/protein characterization data.
Consistent with extensive gene/protein characterization data.
RNA consistency
No internal RNA expression data available for correlation.
No internal RNA expression data available for correlation.
No internal RNA expression data available for correlation.
WESTERN BLOT
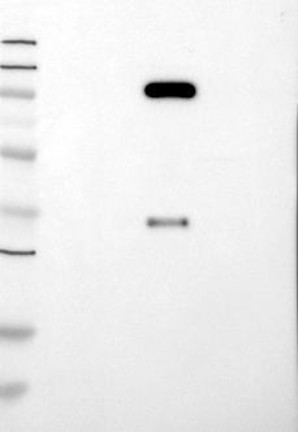
Antibody HPA000951
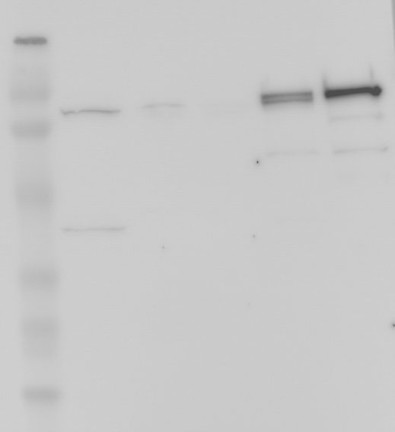
Antibody HPA001817
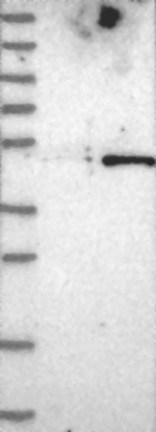
Antibody HPA001832
Antibody CAB016381
Standard validation
Uncertain
Single band larger than predicted size in kDa (+20%) but partly supported by experimental and/or bioinformatic data.
Supported
Analysis performed using a standard panel of samples. Band of predicted size in kDa (+/-20%) with additional bands present.
Uncertain
Analysis performed using a standard panel of samples. Weak band of predicted size but with additional bands of higher intensity also present.
Supported
Analysis performed using a standard panel of samples. Single band corresponding to the predicted size in kDa (+/-20%).
Figure description
Lane 1: Marker [kDa] 250, 130, 95, 72, 55, 36, 28, 17, 10 Lane 2: Negative control (vector only transfected HEK293T lysate) Lane 3: Over-expression Lysate (Co-expressed with a C-terminal myc-DDK tag (~3.1 kDa) in mammalian HEK293T cells, LY400641)
Lane 1: Marker [kDa] 219, 112, 85, 49, 32, 25, 17.5 Lane 2: RT4 Lane 3: EFO-21 Lane 4: A-431 Lane 5: Liver Lane 6: Tonsil
Lane 1: Marker [kDa] 250, 130, 95, 72, 55, 36, 28, 17, 11 Lane 2: RT4 Lane 3: U-251 MG Lane 4: Human Plasma Lane 5: Liver Lane 6: Tonsil
Target mass (kDa)
140.9, 124, 85.5, 34.6
140.9, 124, 85.5
140.9, 124, 85.5
85.5, 34.6, 16.1, 7.3
Antibody dilution
1:250
1:500
1:250
1:500
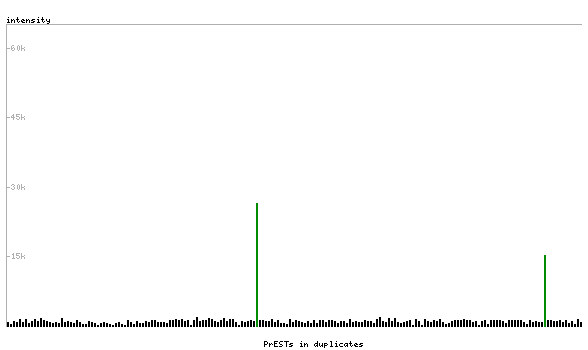
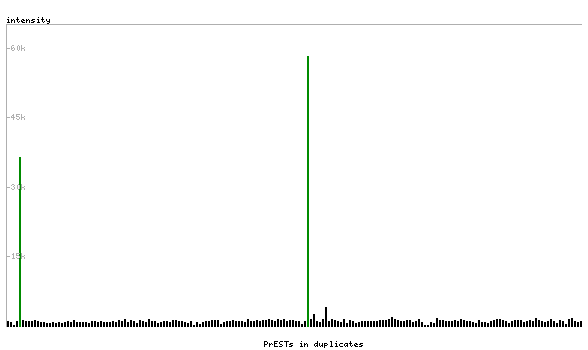
PROTEIN ARRAY
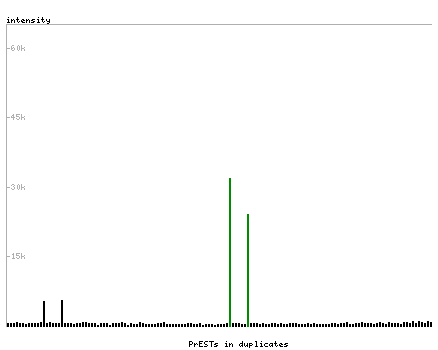
Antibody HPA000951
Antibody HPA001817
Antibody HPA001832
Antibody CAB016381
Standard validation
Approved
Pass with quality comment low specificity (binding to 1-2 PrESTs >15% and <40%).
Supported
Pass with single peak corresponding to interaction only with its own antigen.
Supported
Pass with single peak corresponding to interaction only with its own antigen.
Figure description
Antibody specificity analysis with protein arrays. Predicted and matching interactions are shown in green.
Antibody specificity analysis with protein arrays. Predicted and matching interactions are shown in green.
Antibody specificity analysis with protein arrays. Predicted and matching interactions are shown in green.